Boost Your App
Please fill in the form below and we'll call you back in no time.
243 results found
  • Afghanistan+93
  • Åland Islands+358
  • Albania+355
  • Algeria+213
  • American Samoa+1
  • Andorra+376
  • Angola+244
  • Anguilla+1
  • Antigua & Barbuda+1
  • Argentina+54
  • Armenia+374
  • Aruba+297
  • Ascension Island+247
  • Australia+61
  • Austria+43
  • Azerbaijan+994
  • Bahamas+1
  • Bahrain+973
  • Bangladesh+880
  • Barbados+1
  • Belarus+375
  • Belgium+32
  • Belize+501
  • Benin+229
  • Bermuda+1
  • Bhutan+975
  • Bolivia+591
  • Bosnia & Herzegovina+387
  • Botswana+267
  • Brazil+55
  • British Indian Ocean Territory+246
  • British Virgin Islands+1
  • Brunei+673
  • Bulgaria+359
  • Burkina Faso+226
  • Burundi+257
  • Cambodia+855
  • Cameroon+237
  • Canada+1
  • Cape Verde+238
  • Caribbean Netherlands+599
  • Cayman Islands+1
  • Central African Republic+236
  • Chad+235
  • Chile+56
  • China+86
  • Christmas Island+61
  • Cocos (Keeling) Islands+61
  • Colombia+57
  • Comoros+269
  • Congo - Brazzaville+242
  • Congo - Kinshasa+243
  • Cook Islands+682
  • Costa Rica+506
  • Côte d’Ivoire+225
  • Croatia+385
  • Cuba+53
  • Curaçao+599
  • Cyprus+357
  • Czechia+420
  • Denmark+45
  • Djibouti+253
  • Dominica+1
  • Dominican Republic+1
  • Ecuador+593
  • Egypt+20
  • El Salvador+503
  • Equatorial Guinea+240
  • Eritrea+291
  • Estonia+372
  • Eswatini+268
  • Ethiopia+251
  • Falkland Islands+500
  • Faroe Islands+298
  • Fiji+679
  • Finland+358
  • France+33
  • French Guiana+594
  • French Polynesia+689
  • Gabon+241
  • Gambia+220
  • Georgia+995
  • Germany+49
  • Ghana+233
  • Gibraltar+350
  • Greece+30
  • Greenland+299
  • Grenada+1
  • Guadeloupe+590
  • Guam+1
  • Guatemala+502
  • Guernsey+44
  • Guinea+224
  • Guinea-Bissau+245
  • Guyana+592
  • Haiti+509
  • Honduras+504
  • Hong Kong SAR China+852
  • Hungary+36
  • Iceland+354
  • India+91
  • Indonesia+62
  • Iran+98
  • Iraq+964
  • Ireland+353
  • Isle of Man+44
  • Israel+972
  • Italy+39
  • Jamaica+1
  • Japan+81
  • Jersey+44
  • Jordan+962
  • Kazakhstan+7
  • Kenya+254
  • Kiribati+686
  • Kosovo+383
  • Kuwait+965
  • Kyrgyzstan+996
  • Laos+856
  • Latvia+371
  • Lebanon+961
  • Lesotho+266
  • Liberia+231
  • Libya+218
  • Liechtenstein+423
  • Lithuania+370
  • Luxembourg+352
  • Macao SAR China+853
  • Madagascar+261
  • Malawi+265
  • Malaysia+60
  • Maldives+960
  • Mali+223
  • Malta+356
  • Marshall Islands+692
  • Martinique+596
  • Mauritania+222
  • Mauritius+230
  • Mayotte+262
  • Mexico+52
  • Micronesia+691
  • Moldova+373
  • Monaco+377
  • Mongolia+976
  • Montenegro+382
  • Montserrat+1
  • Morocco+212
  • Mozambique+258
  • Myanmar (Burma)+95
  • Namibia+264
  • Nauru+674
  • Nepal+977
  • Netherlands+31
  • New Caledonia+687
  • New Zealand+64
  • Nicaragua+505
  • Niger+227
  • Nigeria+234
  • Niue+683
  • Norfolk Island+672
  • North Korea+850
  • North Macedonia+389
  • Northern Mariana Islands+1
  • Norway+47
  • Oman+968
  • Pakistan+92
  • Palau+680
  • Palestinian Territories+970
  • Panama+507
  • Papua New Guinea+675
  • Paraguay+595
  • Peru+51
  • Philippines+63
  • Poland+48
  • Portugal+351
  • Puerto Rico+1
  • Qatar+974
  • Réunion+262
  • Romania+40
  • Rwanda+250
  • Samoa+685
  • San Marino+378
  • São Tomé & Príncipe+239
  • Saudi Arabia+966
  • Senegal+221
  • Serbia+381
  • Seychelles+248
  • Sierra Leone+232
  • Singapore+65
  • Sint Maarten+1
  • Slovakia+421
  • Slovenia+386
  • Solomon Islands+677
  • Somalia+252
  • South Africa+27
  • South Korea+82
  • South Sudan+211
  • Spain+34
  • Sri Lanka+94
  • St. Barthélemy+590
  • St. Helena+290
  • St. Kitts & Nevis+1
  • St. Lucia+1
  • St. Martin+590
  • St. Pierre & Miquelon+508
  • St. Vincent & Grenadines+1
  • Sudan+249
  • Suriname+597
  • Svalbard & Jan Mayen+47
  • Sweden+46
  • Switzerland+41
  • Syria+963
  • Taiwan+886
  • Tajikistan+992
  • Tanzania+255
  • Thailand+66
  • Timor-Leste+670
  • Togo+228
  • Tokelau+690
  • Tonga+676
  • Trinidad & Tobago+1
  • Tunisia+216
  • Turkey+90
  • Turkmenistan+993
  • Turks & Caicos Islands+1
  • Tuvalu+688
  • U.S. Virgin Islands+1
  • Uganda+256
  • Ukraine+380
  • United Arab Emirates+971
  • United Kingdom+44
  • United States+1
  • Uruguay+598
  • Uzbekistan+998
  • Vanuatu+678
  • Vatican City+39
  • Venezuela+58
  • Vietnam+84
  • Wallis & Futuna+681
  • Western Sahara+212
  • Yemen+967
  • Zambia+260
  • Zimbabwe+263
Your request has been received! We'll be in touch shortly
Oops! Something went wrong while submitting the form.

What is a CR, and How Does It Impact Your App's Performance?

App Store Optimization
CRO
Mar 18, 2025

In mobile marketing, the conversion rate (also known as CR) is a key metric for assessing an app's product performance and marketing strategy. A higher CR indicates a more successful promotion.

In this article, I will explain how to determine the CR and provide average conversion rates for different categories of apps in the App Store and Google Play.

Even more insights from ASO & UA pros in ASO Busters on Discord!

Why should you measure mobile app conversion rates?

CR is the percentage of users or visitors to a mobile app store page who complete a targeted action (conversion).

These metrics vary between the App Store and Google Play and also depend on the app's category.

Tracking conversions to the desired action helps evaluate an app's effectiveness or investment and provides valuable insights for your promotion strategy.

The main reasons to focus on CR:

  1. User engagement. A high CR typically indicates that the design and user experience align with visitors' expectations, leading to longer app usage and improved user retention.
  2. Monetization. The higher the conversion rate, the more revenue an app will generate. This is especially true for apps and games with in-app purchases, as well as those that rely on subscriptions as a monetization tool.
  3. A/B testing. CR is essential for evaluating A/B testing results. By identifying the most effective tested elements, you can implement them for better performance.
  4. Resource allocation and cost-effectiveness. In user acquisition, ROI (return on investment) plays a key role and increases as CR improves.
  5. ASO optimization. An engaging app page tailored to your target audience boosts organic installs and page visits. Additionally, conversion rate impacts ranking, as the App Store and Google Play algorithms favor apps that attract and retain users.
Attribute
Value
Format
PNG
Color space
Display P3 (wide-gamut color), sRGB (color), or Gray Gamma 2.2 (grayscale).
See Color Management.
Layers
Flattened with no transparency
Resolution
Shape
Square with no rounded corners
Attribute
Value
Format
PNG
Color space
Display P3 (wide-gamut color), sRGB (color), or Gray Gamma 2.2 (grayscale).
See Color Management.
Layers
Flattened with no transparency
Resolution
Shape
Square with no rounded corners
Word
Frequency in service
Qimai(China)*
AppTweak
Mobileaction
Appfollow
课程 (course)
5387 (high)
56 (mid)
5 (low)
34 (mid)
外语 (foreign language)
5699 (high)
35 (mid)
5 (low)
34(mid)
播放 (play)
5496 (high)
35 (mid)
5 (low)
35 (mid)
*Search index in China provided by Qimai and based on multidimensional calculations such as search results, downloads and relatable keywords.
App Store
Google Play
1. Icon impact on user choice
Important, but not more than a video with screenshots, as they take up most of the screen
Icon is displayed with several other icons in search results, and therefore it has the greatest impact on the user's choice
2. Icon localization
1 icon for all locales
Can be localized for each country
3. Screenshots quantity, orientation
From 1 to 10, any orientation
From 2 to 8, any orientation
4. Screenshots the most important are the ones that are visible before you start scrolling
  • Vertical screenshots: 3 are visible
  • Horizontal screenshots: only the first one is visible
  • Vertical screenshots: 4 are visible
  • Horizontal screenshots: only the first one is visible
5. Screenshots size
Large — the content is legible
Much smaller — the captions are quite illegible
6. Video quantity
Up to 3
One video that must be uploaded to YouTube
7. Video orientation
Any orientation
Horizontal orientation prioritized
8. Video autoplay
Plays automatically for 30 seconds without sound
You need to click on it to play
9. Application cover
Displayed on the application and developer pages
There is no cover
10. Graphics update
After release only
Whenever

Conversion rate metrics on the App Store and Google Play

The main ones include:

  1. Install Rate (Impression-to-install). This is the percentage of users who installed an app directly from search results or featured selections in the Today, Games, and Apps tabs without visiting its App Store page. This metric is not applicable to Google Play.
  2. Page view-to-install. In the context of mobile applications, this ratio represents the percentage of visitors who installed the application after visiting its app store page. This indicator is relevant only for Google Play, as the App Store includes installs from search in the total count but does not separate them from page views. Therefore, for the App Store, referring to the page views-to-install ratio as a conversion rate is inaccurate, as many users install the app without visiting its page.

For both stores, you can identify auxiliary metrics:

  1. In-app Conversion Rate (Install-to-purchase). Indicates the percentage of users who completed a targeted action after installing the app, such as subscribing or making an in-app purchase.
  2. Advertising Conversion Rate. Allows you to estimate the percentage of users who clicked on an ad - click-through-rate, and in Apple Search Ads - tap-through-rate. It is calculated as the number of clicks or taps divided by the total number of ad impressions.

It also displays the percentage of users who saw the ad and performed the targeted action - installation (the ratio of app installs to the total number of ad impressions).

  1. Average Time on Page. Indicates the average time users spend on the app page before installing it.
  2. App Page Scroll Depth. Indicates the percentage of content on the mobile app store page that visitors view.
Device or context
Icon size
iPhone
60x60 pt (180x180 px @3x)
60x60 pt (120x120 px @2x)
iPad Pro
83.5x83.5 pt (167x167 px @2x)
iPad, iPad mini
76x76 pt (152x152 px @2x)
App Store
1024x1024 pt (1024x1024 px @1x)
Source language
Target language
How much longer (+) or shorter (–) the text in the target language is
English
French
21.18%
English
Spanish
19.52%
English
Italian
17.91%
English
Deutsch
16.67%
English
Dutch
13.80%
English
Portuguese (Portugal)
14.29%
English
Portuguese (Brazil)
12.96%
English
Polish
9.33%
English
Russian
9.11%
English
Czech
3.70%
English
Arab
–6.25%
English
Japanese
–39.68%
English
Korean
–44.04%
English
Chinese (Simplified)
–61.97%
English
Chinese (Traditional)
–63.80%
*Search Ads Popularity (SAP)shows the popularity of the search term from 5 to 99.

How to determine app store conversion rate?

App Store 

CR in App Store Connect helps you determine how often users install your app after seeing it in the App Store. This metric is calculated as the ratio of Total Downloads to Unique Impressions.

Note: The Total Downloads metric includes all app installs, including repeat downloads and pre-orders before the official release.

Note 2: Unique Impressions include all unique impressions from the Today, Games, Apps, or Search tabs in the App Store, as well as views of your product page. 

In the App Store, conversion data can be found in the Analytics section, after selecting the desired app. The Overview, Acquisition, and Metrics tabs provide various options for visualizing data:

Conversion graph on the Overview tab
Conversion graph in the Acquisition tab
Conversion graph in the Benchmarks tab. You can customize it by selecting specific time periods, filters (device, iOS version, region, etc.), and data display options (by day, week, or month).

Google Play

Unlike the App Store, Google Play calculates conversion as the ratio of Store Listing Acquisitions to Store Listing Visitors.

Store Listing Acquisitions - the total number of users who visited the app store listing page and installed it without previously downloading it on other devices. Store Listing Visitors - the number of visitors who visited the app store listing page and installed it for the first time. 

Since the number of clicks to the app's store listing page is much lower than its impressions in the store, the CR on Google Play will be significantly higher than on iOS.

In Google Play, conversion data is located in the Grow → Store performance → Listing conversion analysis section:

In addition to graphs showing page visits and installs over time, this section includes a conversion rate dynamics chart, which also compares your app’s performance with competitors in the same category (Peers' Median and Peers' Range):

Conversion dynamics in Google Play

Similar to the App Store, you can apply various filters when creating a chart: by country, traffic source, device language, search term, etc.

Device
Spotlight icon size
Settings icon size
Notification icon size
iPhone
40x40 pt (120x120 px @3x)
29x29 pt (87x87 px @3x)
38x38 pt (114x114 px @3x)
40x40 pt (80x80 px @2x)
29x29 pt (58x58 px @2x)
38x38 pt (76x76 px @2x)
iPad Pro, iPad, iPad mini
40x40 pt (80x80 px @2x)
29x29 pt (58x58 px @2x)
38x38 pt (76x76 px @2x)
Search term
Translation
SAP* English (U.S.)
SAP* English (U.K.)
truck games
games with trucks
62
39
lorry games
games with trucks
32
jail games
prison games
29
8
prison games
prison games
32
24
*Search Ads Popularity (SAP)shows the popularity of the search term from 5 to 99.
Google Play
App Store
What can be tested?
  • Short description
  • Long description
  • Icon
  • Feature graphics
  • Screenshots
  • Videos
  • Screenshots
  • Videos
  • Icon (has to be uploaded to the build*)
Number of simultaneously running tests
5 tests (each test is valid within a single country.

You can choose a default country test (details below): then it will run in all countries where there are no localized graphical or textual materials.
1 test (the test can be immediately extended to all countries where the application is available or opt for specific countries as needed)
The number of test variants that can be tested with the current version in the store
Compared with a maximum of 3 new variants
Can a test be launched while another item is under review?
Yes
No
Mandatory formats for screenshots uploaded to the store
6.5
  • 6.5
  • 5.5
  • 12.9 (if there is an iPad version)
*Build – is a new version of the application. Updating the icon is only possible when updating the application version in the store. In other words, the term "build" refers to a specific version or variant of the application that is ready to be downloaded and installed on the users' devices. It contains all the necessary files and data for users to install and use the application.
More about optimizing graphic elements in the App Store and Google Play can be found in the article 'Graphics in Mobile App Promotion in the App Store and Google Play (ASO) – How to Optimize Graphic Elements.'

Average Conversion Rates by App Category in the App Store

As of September 2024, the average conversion rate in the App Store from search was 6.6% in the United States. In Ukraine, it is higher - 9.1%.

Keep in mind that conversion rates vary by category and traffic source. Consider these factors when selecting a benchmark for your app.
Points scored
Source: appfollow.io

In the US, the highest conversion rates are in the Travel (11.8%), Food & Drink (10.8%), and Navigation (10.5%) categories. The lowest CR is in the Games category - 1.9%. Depending on the genre of the game, this average can vary from 1.4% (Casino and Racing) to 4.8% (Trivia).

Points scored
Source: appfollow.io

It is worth noting that conversion rate is not a static metric and can fluctuate over time. In 2024, the U.S. categories with the most variable CR include:

  • Food & Drink saw a sharp increase in March;
  • Graphics & Design - growth since the second quarter;
  • Navigation and Travel started to grow in Q2, peaking in July, the holiday season;
  • Shopping - a sharp increase in CR in July, which may be due to off-season sales;
  • Sports - a sharp increase in CR in March, followed by a further decline;
  • Weather - gradual growth throughout the year.
Points scored
Source: appfollow.io

Average conversion rates vary by country and by category. In Ukraine, the highest CR is seen in the Reference (25.8%), Navigation (17.7%), and Travel (12.7%) categories.

Points scored
Source: appfollow.io

Similar to the U.S., games have the lowest CR in Ukraine at 2.7%. The lowest conversion rate is in the Card genre (1.9%), and the highest is in the Role Playing genre (7.1%).

Points scored
Source: appfollow.io

In 2024, the most significant fluctuations in CR in Ukraine were observed in the following categories:

  • Developer Tools - growth peaks in February and June;
  • Music saw a significant decline after the Eurovision Song Contest;
  • in the Navigation and Travel categories, unlike in the US, the conversion rate decreased in the summer months;
  • Reference - a sharp increase in February with further growth;
  • Shopping - CR growth during off-season sales;
  • Sports - there was an increase in conversion in May (before the UEFA Champions League final) and in August (the Olympic Games in Paris).
Points scored
Source: appfollow.io
Device size or platform
Screenshot size
Requirement
Screenshot source
6.5 inch (iPhone 13 Pro Max, iPhone 12 Pro Max, iPhone 11 Pro Max, iPhone 11, iPhone XS Max, iPhone XR)
1284 x 2778 pixels (portrait)2778 x 1284 pixels (landscape)1242 x 2688 pixels (portrait)2688 x 1242 pixels (landscape)
Required if app runs on iPhone
Upload 6.5-inch screenshots
5.8 inch (iPhone 13 Pro, iPhone 13, iPhone 13 mini, iPhone 12 Pro, iPhone 12, iPhone 12 mini, iPhone 11 Pro, iPhone XS, iPhone X)
1170 x 2532 pixels (portrait)2532 x 1170 pixels (landscape)1125 x 2436 pixels (portrait)2436 x 1125 pixels (landscape)1080 x 2340 (portrait)2340 x 1080 (landscape)
Required if app runs on iPhone and 6.5 inch screenshots are not provided
Default: scaled 6.5-inch screenshotsAlternative: upload 5.8-inch screenshots
5.5 inch (iPhone 8 Plus, iPhone 7 Plus, iPhone 6s Plus)
1242 x 2208 pixels (portrait)2208 x 1242 pixels (landscape)
Required if app runs on iPhone
Upload 5.5-inch screenshots
5.5 inch (iPhone 8 Plus, iPhone 7 Plus, iPhone 6s Plus)
2048 x 2732 pixels (portrait)2732 x 2048 pixels (landscape)
Required if app runs on iPad
Upload 12.9-inch iPad Pro (3rd generation) screenshots
5.5 inch (iPhone 8 Plus, iPhone 7 Plus, iPhone 6s Plus)
2048 x 2732 pixels (portrait)2732 x 2048 pixels (landscape)
Required if app runs on iPad
Upload 12.9-inch iPad Pro (2nd generation) screenshots
Price
Traffic Source (Self Reporting Networks)
Facebook
Google
X (Twitter)
Apple Search Ads
Cohort reports
Impression tracking
Audience segmentation
At extra charge
Custom Dashboards
Custom Reports
At extra charge
Advertisement Cost
DAU/MAU (Stickiness)
Raw Data Export
At extra charge
At extra charge
At extra charge
API Reporting
Search term
Translation
SAP* French
SAP* French (Canada)
soldes
sale
25
5
aubainerie
sale
14
*Search Ads Popularity (SAP)shows the popularity of the search term from 5 to 99.

Average Conversion Rates by App Category on Google Play

Average Conversion Rates by App Category on Google Play

The average Page view-to-install rate in September 2024 was 46.2% in Ukraine and 47.4% in the US.

Points scored
Source Google Play Console

The highest average conversion rate in both Ukraine and the US is in the Travel & local category - 58.4% and 60.8%, respectively. In the US, the Food & drink category also has an average CR of over 60% (60.3%).

The categories with the lowest CR in Ukraine include Weather (35.7%), Personalization (37.9%) and Art & design (38.9%). In the US, these are Art & Design and Personalization (36.8%), Comics (37.5%).

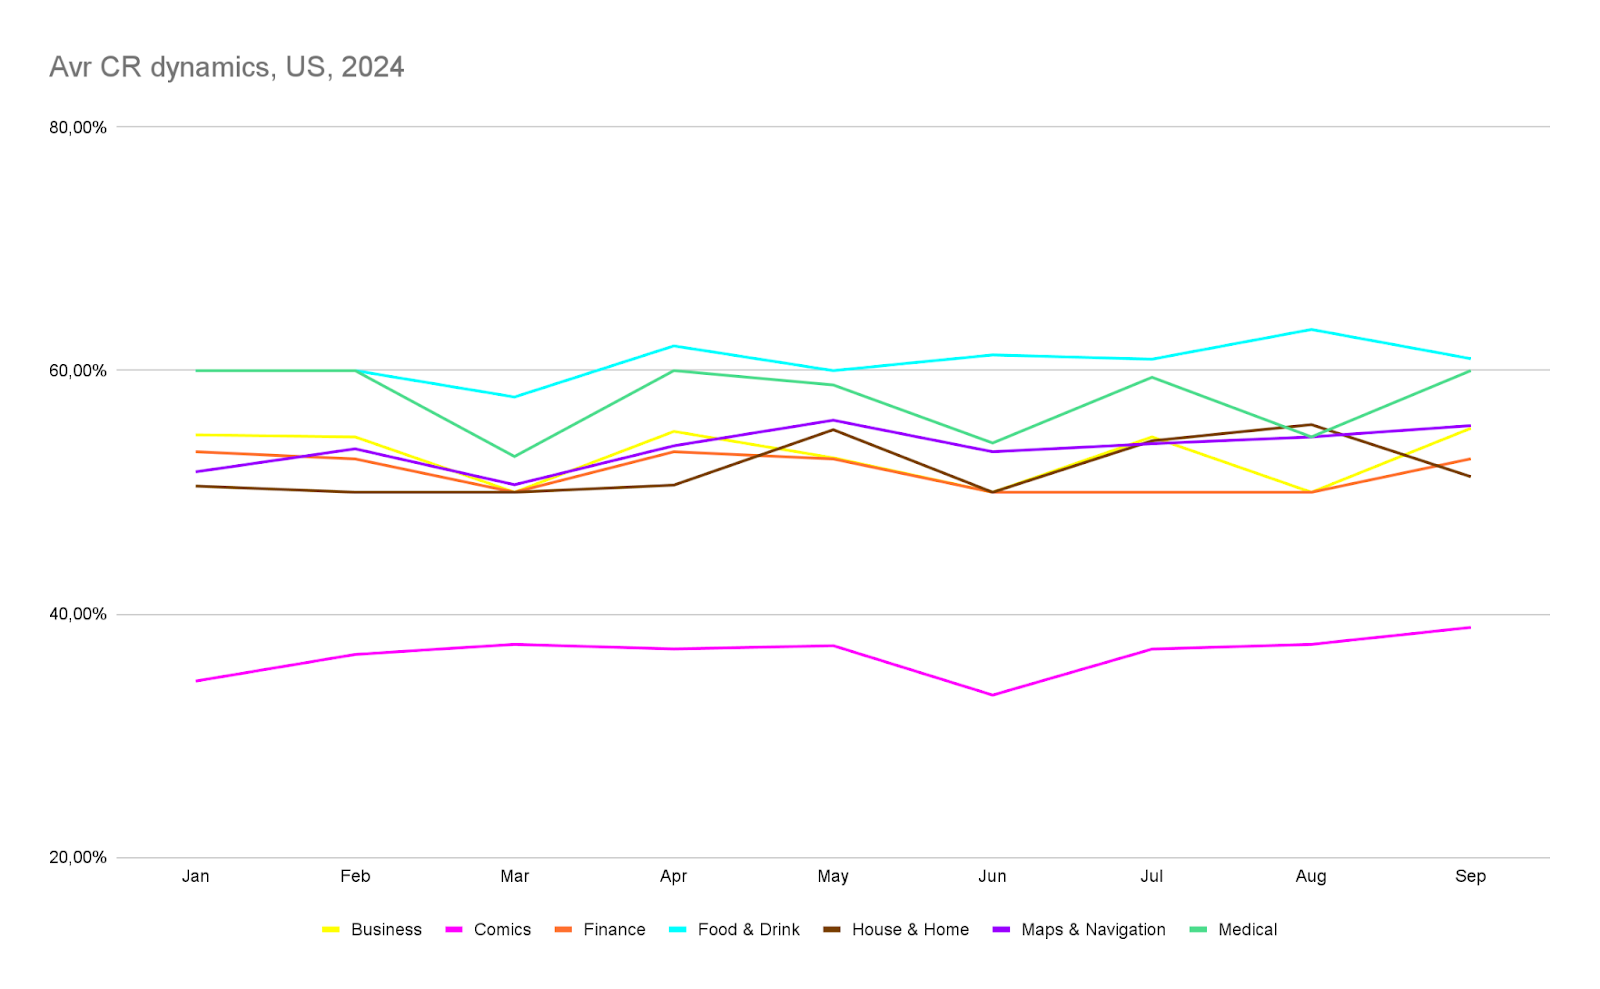
Looking at the conversion rate in dynamics, the most dynamic categories in the US in 2024 include:

  • Business;
  • Comics;
  • Finance;
  • House & Home;
  • Medical;
  • Maps & Navigation and Food & Drink are also among the most fluctuating categories in terms of CR in the App Store.
Points scored
Source Google Play Console

In Ukraine, CR fluctuations are more noticeable than in the United States, reaching 10-12 percentage points in some categories, for example:

  • Travel & Local is also one of the most variable categories in terms of CR in the App Store;
  • Events;
  • Live television;
  • News & Magazines;
  • Parenting.

The fluctuation of CR in the Education and Video players & Editors categories is slightly less pronounced (7-9 points).

Points scored
Source Google Play Console
Device
Icon size
iPhone
180px × 180px (60pt × 60pt @3x)
120px × 120px (60pt × 60pt @2x)
iPad Pro
167px × 167px (83.5pt × 83.5pt @2x)
iPad, iPad mini
152px × 152px (76pt × 76pt @2x)
App Store
1024px × 1024px (1024pt × 1024pt @1x)
Icon format
PNG
Color models
sRGB or P3 (see "Color Management")
Layouts
Aligned without transparency
Sizes
Shape
Square without rounded corners
All the current requirements for icons are specified in the specification.

Icon format
32-bit PNG (with alpha channel)
Color models
512 х 512 pixels
Layouts
1024 КБ
Sizes
square, without rounding and shadows (Google automatically rounds the corners and adds shadows)
All the current requirements are specified in the specification.

Traffic
Popularity
Keyword
Translate (EN)
1
73 358
97
LINE
LINE
2
63 741
96
すいかゲーム
Watermelon game
3
60 751
96
youtube
youtube
4
50 838
94
インスタ
qq
5
44 686
94
x
Quark
6
43 836
93
tiktok
Honor of Kings
7
36 785
92
tinder
Little Red Book (Xiaohongshu)
8
35 582
92
google
Jitterbug (Douyin) Extreme
9
28 381
90
instagram
Pinduoduo
10
27 412
90
twitter
Baidu

Traffic
Popularity
Keyword
1
385 585
99
instagram
2
325 480
98
whatsapp
3
201 485
95
telegram
4
177 737
94
facebook
5
119 067
91
tik tok
6
92 427
90
ifood
7
80 473
87
tinder
8
69 379
87
capcut
9
65 120
87
nubank
10
64 602
86
uber

Traffic
Popularity
Keyword
Translate (EN)
1
233 158
99
snapchat
snapchat
2
209 668
98
instagram
instagram
3
114 577
94
tik tok
tik tok
4
92 500
93
telegram
telegram
5
70 286
91
facebook
facebook
6
59 302
90
tinder
tinder
7
51 352
89
whatsapp
whatsapp
8
42 468
87
youtube
youtube
9
36 646
86
tiktok
tiktok
10
36 420
86
messenger
messenger

Traffic
Popularity
Keyword
Translate (EN)
1
243 626
99
instagram
instagram
2
122 131
95
snapchat
snapchat
3
74 161
91
tik tok
tik tok
4
67 431
91
whatsapp
whatsapp
5
55 634
89
reddit
reddit
6
40 775
87
youtube
youtube
7
39 319
87
tinder
tinder
8
37 889
87
facebook
facebook
9
37 600
86
telegram
telegram
10
26 225
84
brawl stars
brawl stars

Traffic
Popularity
Keyword
1
123 159
99
instagram
2
91 584
97
snapchat
3
52 253
93
facebook
4
28 524
89
tik tok
5
25 788
88
reddit
6
23 972
88
youtube
7
23 005
88
tinder
8
20 257
87
whatsapp
9
17 652
86
messenger
10
14 431
84
discord

Traffic
Popularity
Keyword
Translate (EN)
1
96 271
99
인스타그램
Instagram
2
66 339
97
vpn
vpn
3
47 883
94
카카오톡
KakaoTalk
4
40 069
93
유튜브
YouTube
5
39 041
93
배달의민족
Delivery ethnicity
6
33 538
92
x
x
7
32 794
92
트위터
Twitter
8
29 047
90
쿠팡플레이
Coupang Play
9
21 262
89
네이버
Naver
10
18 882
88
티빙
Tibing

Traffic
Popularity
Keyword
1
144 520
99
instagram
2
102 720
97
snapchat
3
70 760
94
facebook
4
45 775
91
tik tok
5
26 665
88
youtube
6
25 880
87
reddit
7
24 777
87
tinder
8
21 923
86
whatsapp
9
21 702
86
messenger
10
15 312
84
spotify

Traffic
Popularity
Keyword
Translate (EN)
1
38 906
98
телеграм
telegram
2
24 281
95
telegram
telegram
3
20 773
93
бравл старс
brawl stars
4
17 750
91
пабг
YouTube
5
16 308
91
дія
Delivery ethnicity
6
15 075
91
tik tok
x
7
12 534
90
instagram
Twitter
8
11 554
89
вайбер
viber
9
11 418
89
brawl stars
brawl stars
10
11 205
89
viber
viber

Conclusion

  1. CR is a key performance indicator in mobile marketing, representing the percentage of users who complete a targeted action. Optimizing CR can drive more installs and increase the percentage of users who make a purchase or subscribe.
  2. Conversion rates are not fixed; they vary based on the app store (App Store vs. Google Play) and app category.
  3. CR is an important indicator when evaluating user engagement, A/B testing results, ASO optimization, resource allocation, and many other processes.
  4. CR is calculated differently across platforms: in the App Store, it is the ratio of installs to impressions, while in Google Play, it is the ratio of installs to app store listing page visitors.
  5. The average CR varies by country (market) and changes over time. For each product, the process of working on conversion will differ depending on the goals, niche, market situation, and user needs.

Home
Up