

Seasonality in ASO isn’t just about adding a snowflake to your icon in December or putting sunglasses on your mascot in June. It’s about understanding exactly when users start actively searching for apps in your category, which search terms gain momentum before peak demand, and how competition for visibility on the App Store page changes throughout the season.
In this article, I’ll explain how to analyze demand using Search Ads Popularity and explore seasonal trends across different app categories.

If you can see in advance when interest in certain search terms begins to grow, you can prepare your App Store page well before demand peaks. Update your semantic core, optimize your metadata, test new screenshots, launch an In-App Event, or boost organic visibility with Apple Ads campaigns so you don’t lose ground to competitors during seasonal peaks.
To track this, you’ll need Search Ads Popularity (SAP). This is an official Apple Ads metric that measures how often users search for specific keywords in the App Store. The scale ranges from 5 to 100, where 5 indicates low search interest and 100 indicates the highest level of search popularity.
SAP is calculated separately for each country; a popularity score of 100 in the U.S. does not reflect the same level of popularity in the Czech Republic. The same applies to impressions—search terms with identical SAP values can generate significantly different impression volumes depending on the country.
In 2025, following changes to the Apple Search Ads API, some ASO tools recorded a sharp decline in keyword popularity. In fact, the App Store began assigning minimal popularity to low- and medium-frequency search terms.
To continue using one of the key metrics in ASO, the Asolytics team developed the MLP Popularity tool. Consequently, the graphs display actual SAP data from the App Store in blue, and the predicted popularity—used when the Popularity value appears unrealistically low—is shown in purple. A gray dotted line indicates missing data for a given day. In these cases, the value is estimated based on the nearest available data points.
But why track SAP for each search term individually if we’re already conducting a classic niche analysis using the Market Research tool in Asolytics—and the install graph already clearly shows seasonality at the category level?
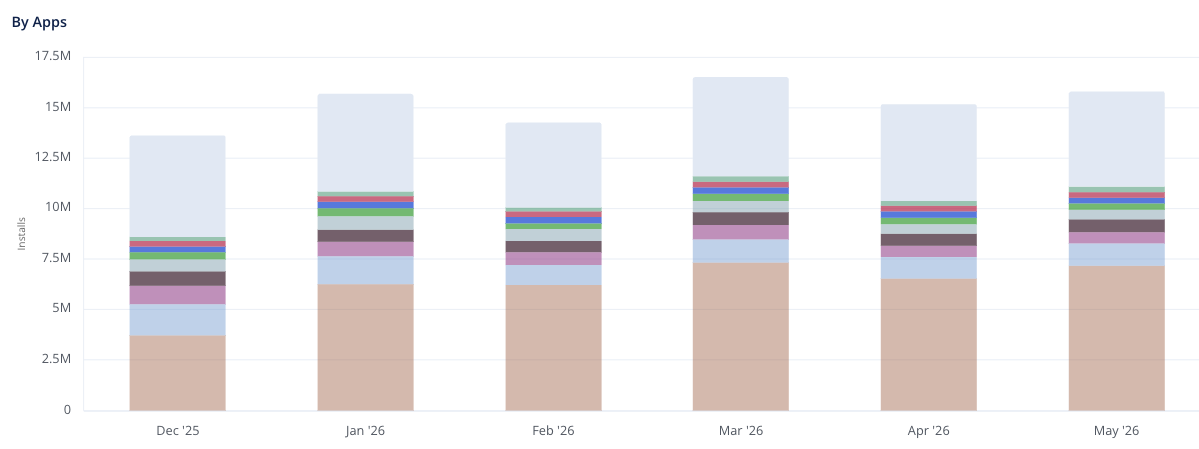
A classic niche analysis helps identify seasonality at the market and competitor levels: when a category becomes more active, what creative content apps are updating, and how visibility changes. SAP analysis, however, provides a more precise snapshot. It shows how the popularity of specific search terms changes over time—sometimes on a daily basis. This level of granularity allows you not only to identify seasonality after the fact, but also to prepare your ASO strategy ahead of peak demand.
Next, I’ll explore how SAP reflects the rise or fall of seasonal demand across different niches using real examples.
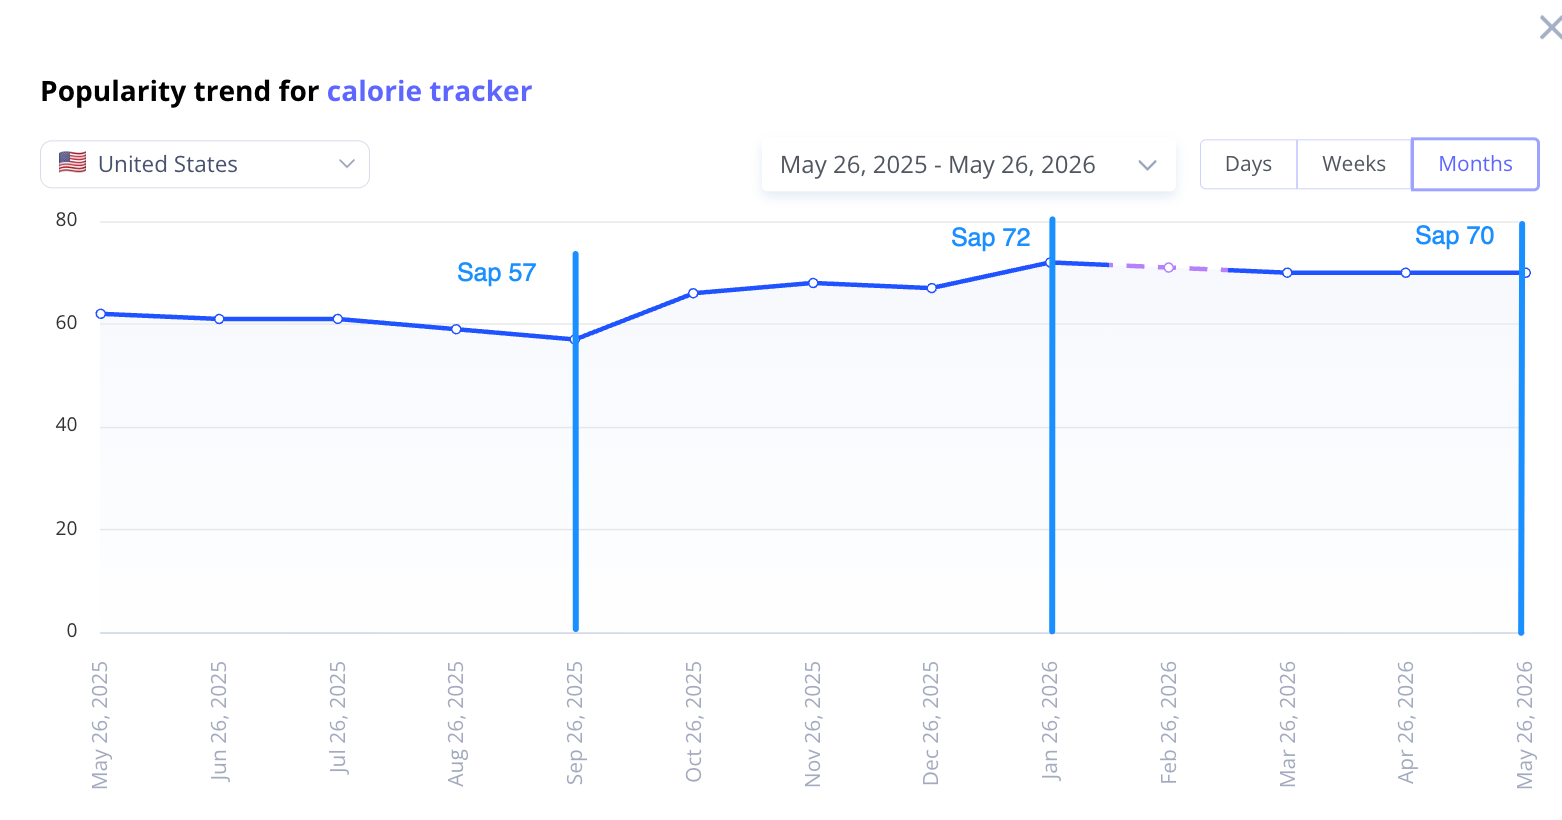
The SAP for “Calorie Tracker” in September is 57, but it begins to rise in October and peaks in January, after the New Year’s holidays. This pattern is expected, as the start of the year is when many people commit to “new year, new life” goals, focusing on healthier habits, exercise, and a more balanced diet. SAP then remains relatively high through May, driven by the seasonal push to “get in shape for summer.”
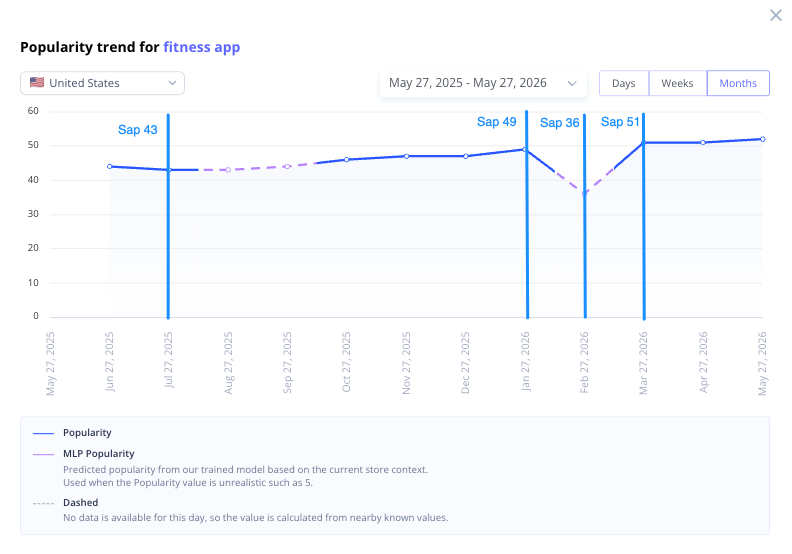
Speaking of sports, searches for “Fitness app” remain relatively stable throughout most of the year, with minor fluctuations and a noticeable spike in January after the New Year holidays. In February, however, there is a dip in popularity as New Year motivation fades and spring-driven inspiration for exercise has not yet begun. By March, with the arrival of the first warmer days and increased daylight, search volume rises again.
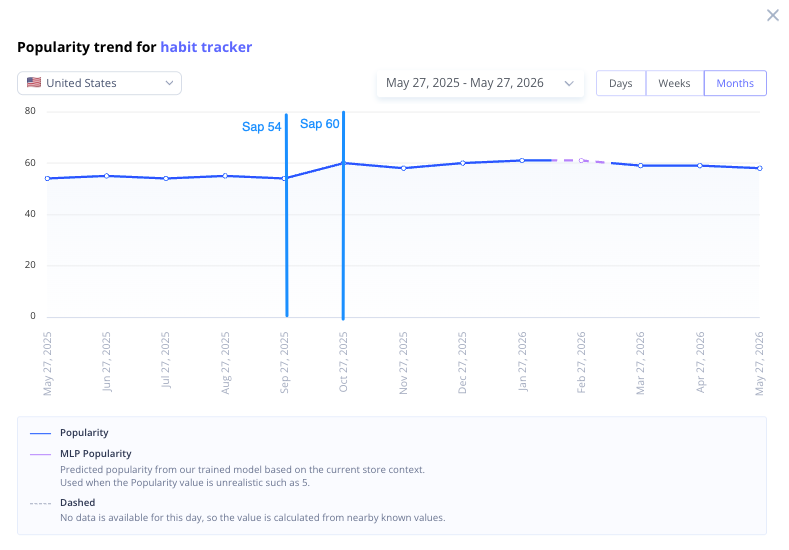
However, for the search term “Habit Tracker”, the seasonal uptick begins as early as fall. During this period, users actively look for apps that help them focus on studies, structure their daily routines, and receive reminders about pending tasks—in short, tools to improve productivity.
The travel niche remains popular year-round, but it also has a certain degree of seasonality.
Although “Tripadvisor” is a brand name, it has essentially become widely used as a synonym for a travel planner. Search volume typically drops at the end of summer, when the vacation season ends, and picks up again starting in October.
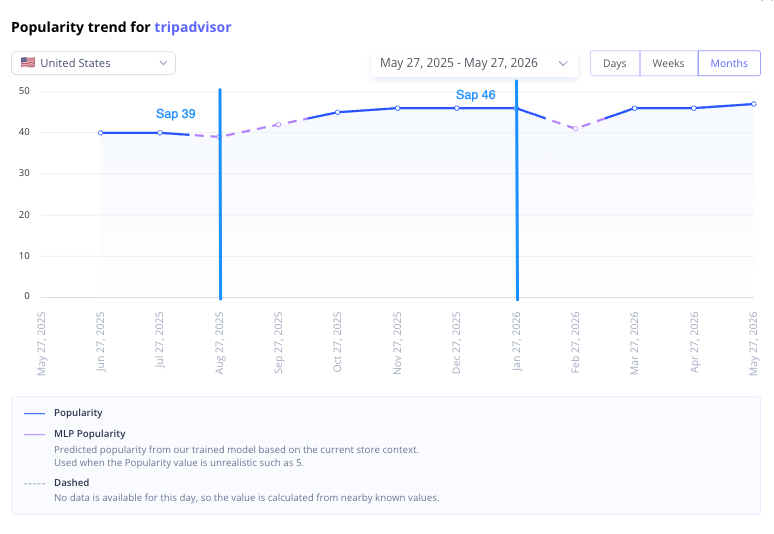
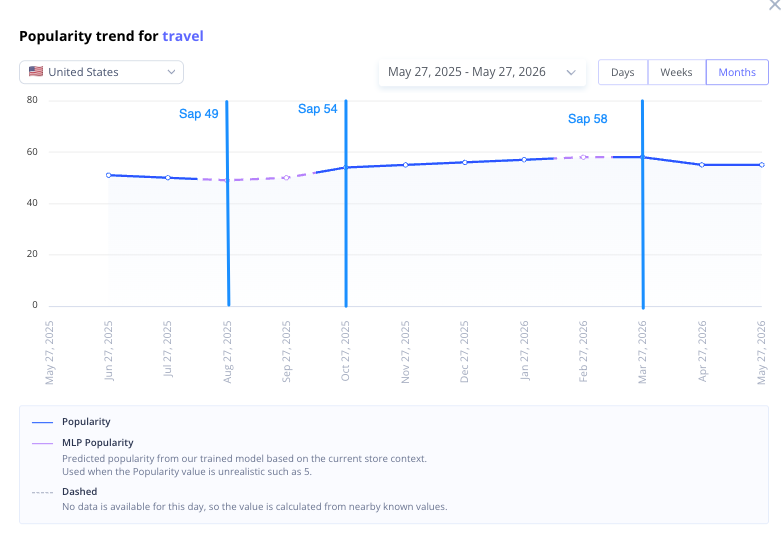
The search term “Travel” largely follows the same trend as the previous keyword.
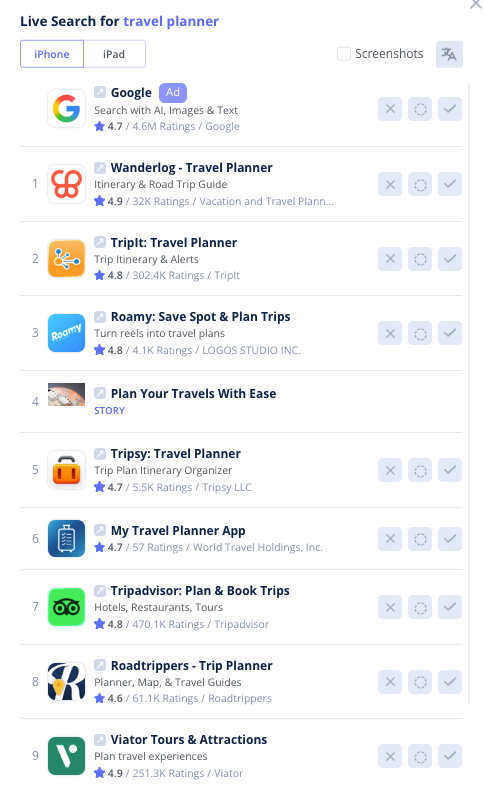
The “Travel Planner” term, however, seems to lag slightly behind the previous ones, declining from August through October and then rising significantly in November.
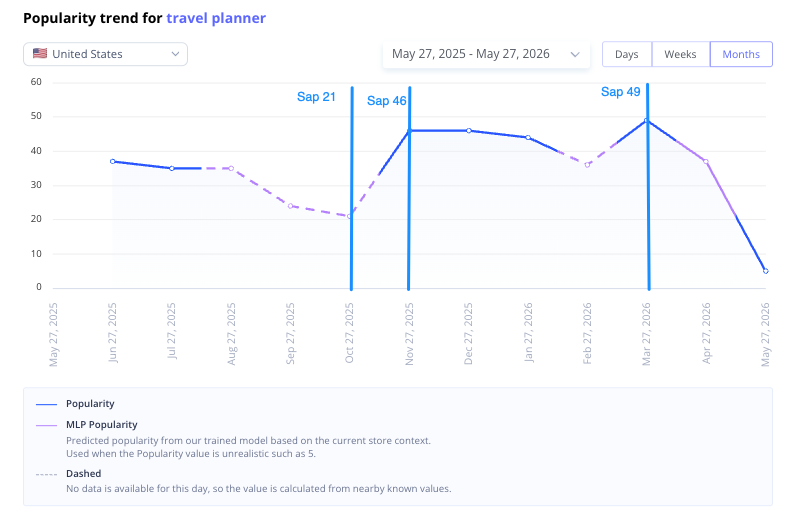
One niche, similar search terms, but the seasonal fluctuations in popularity differ. So, does seasonality not have a significant impact? Actually, no—that’s where user intent behind each search term comes into play. Yes, the niche is the same and the terms are similar, but the underlying search intent—and therefore the results—can differ significantly.
People search for “Travel” when they want apps that help them prepare for a trip—such as buying tickets, booking hotels or apartments, or renting a car.
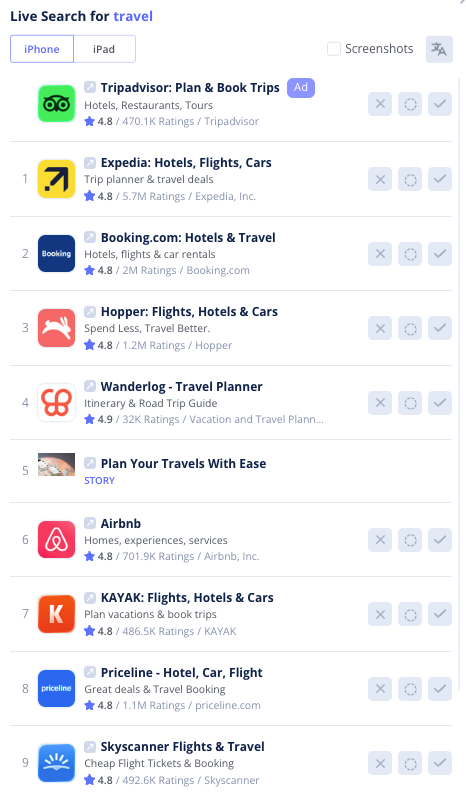
With the “Travel Planner” term, users are looking for apps that help them consolidate already purchased tickets and reservations in one place, as well as save and organize locations they want to visit.
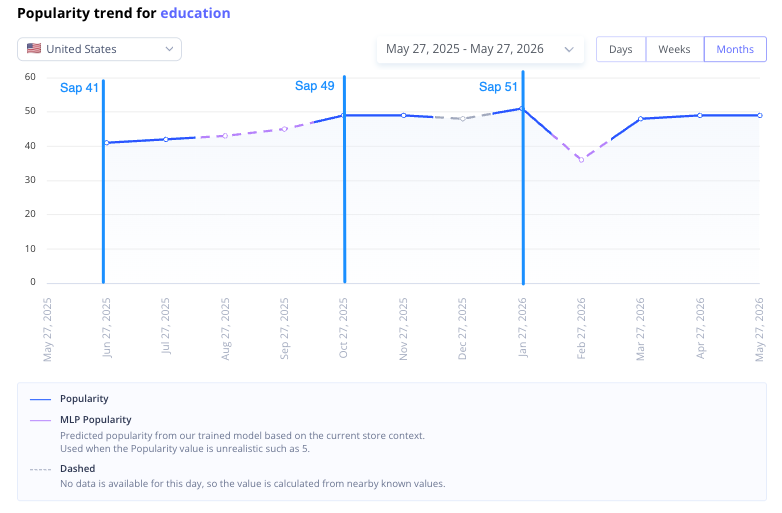
Search terms in the education niche traditionally peak in September and January—before the start of new academic semesters. The search volume for “Education” increases from 41 in July to 51 in January.
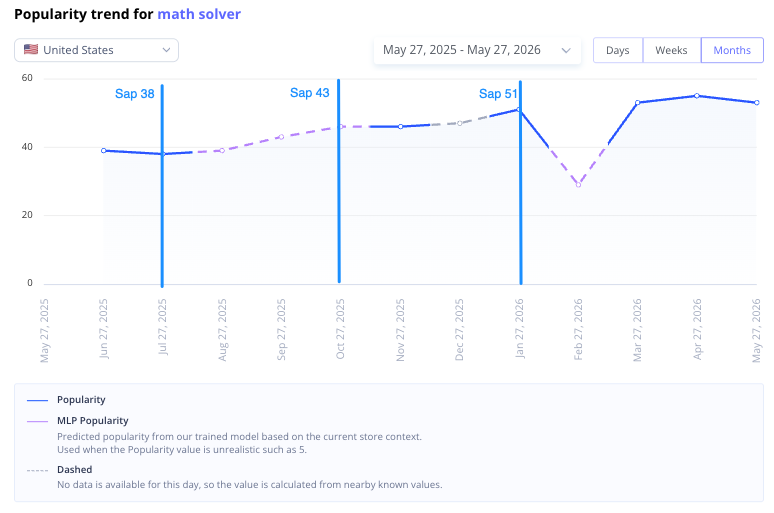
The search term “math solver” follows the same seasonal trend.
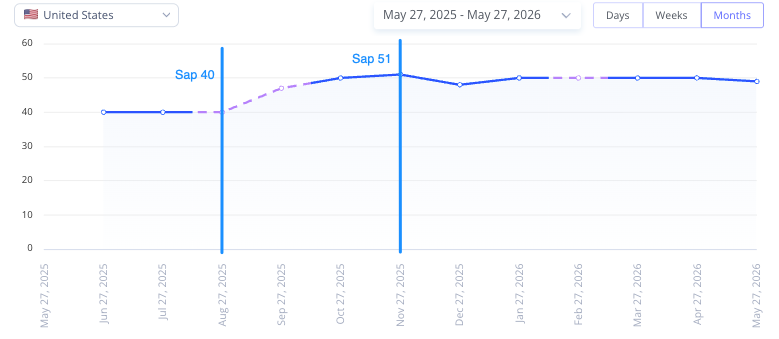
The search term “Flashcards,” used by people looking for apps to create and study with flashcards, begins gaining popularity in September and maintains a consistently high SAP throughout the academic year.
Sometimes changes in search term popularity can be observed not over months, but over the course of just a few weeks. This is known as event-driven seasonality. For example, this pattern is observed in cryptocurrencies.
The search term “Bitcoin” gained 7 points in SAP between September and early October 2025, increasing from 54 to 61.
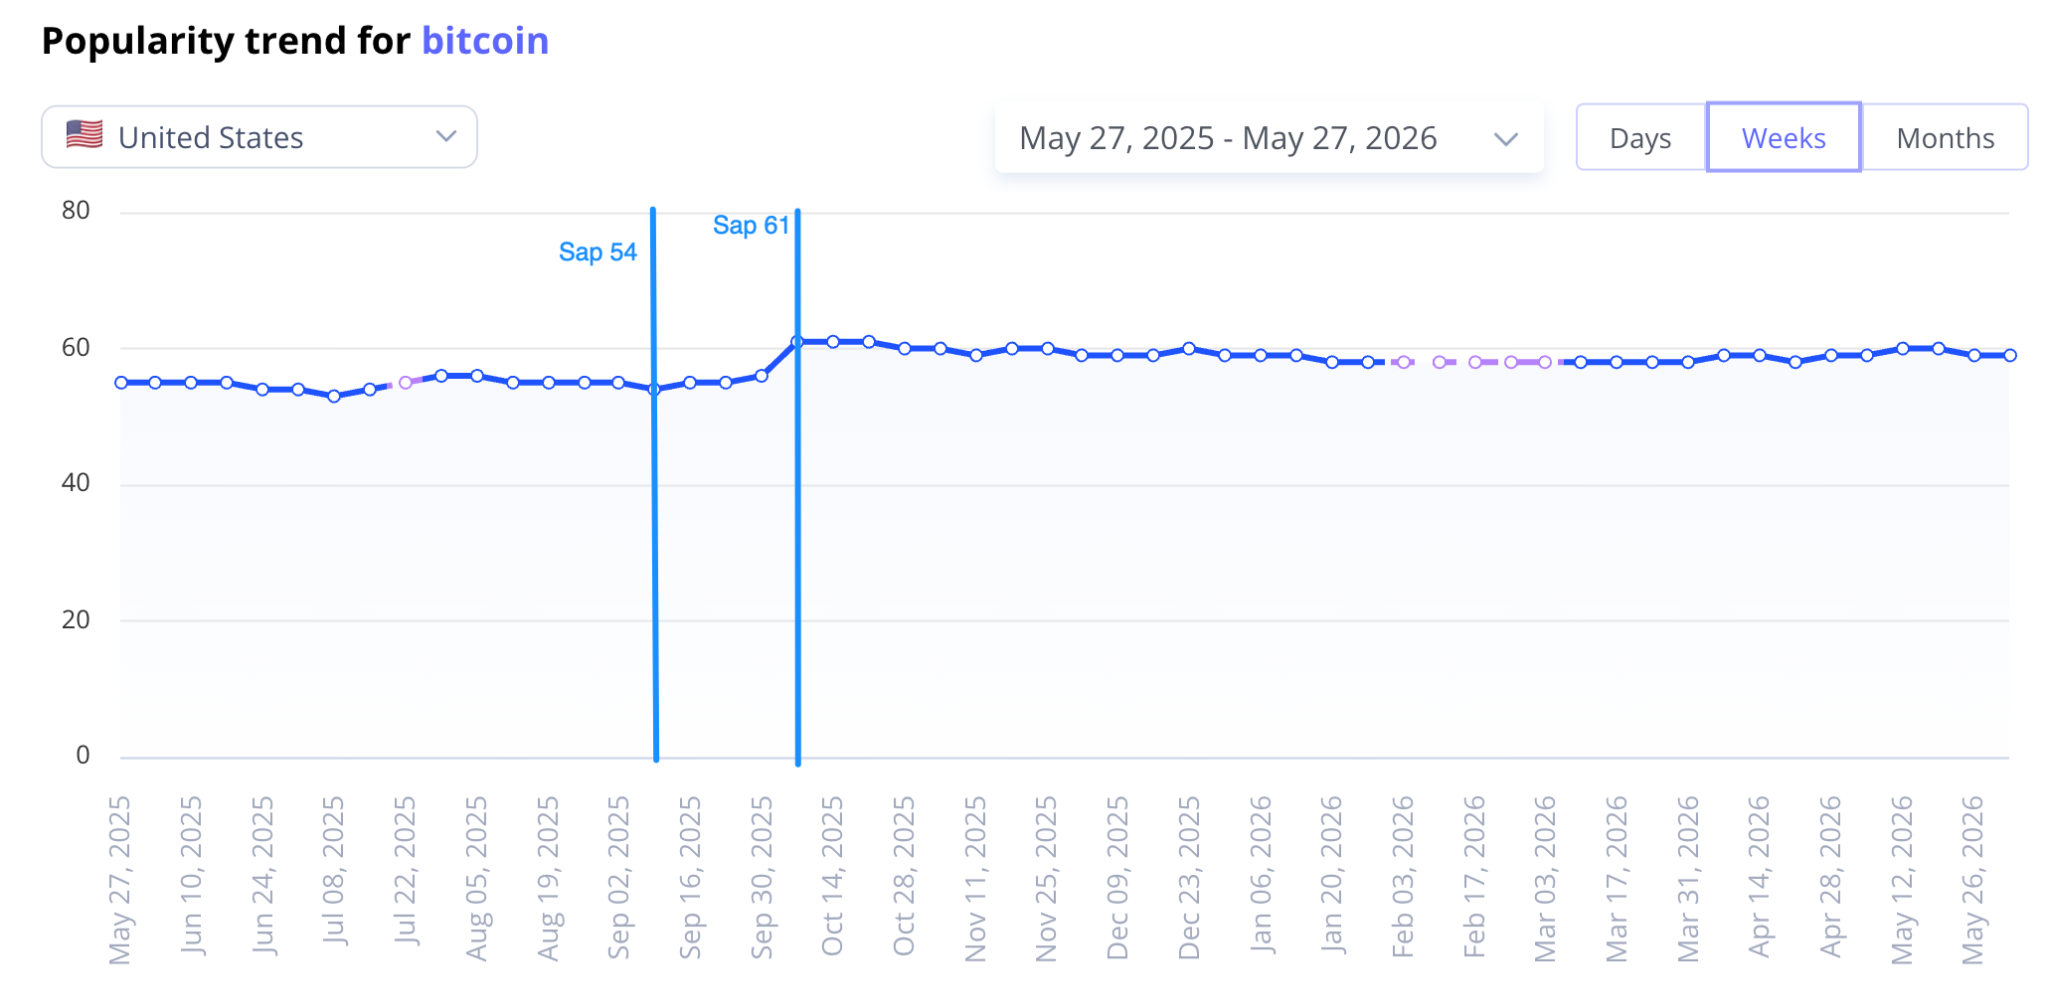
At first glance, this appears to be a modest increase. However, the search term “Crypto” shows a similar trend over the same period, rising from 55 to 62.
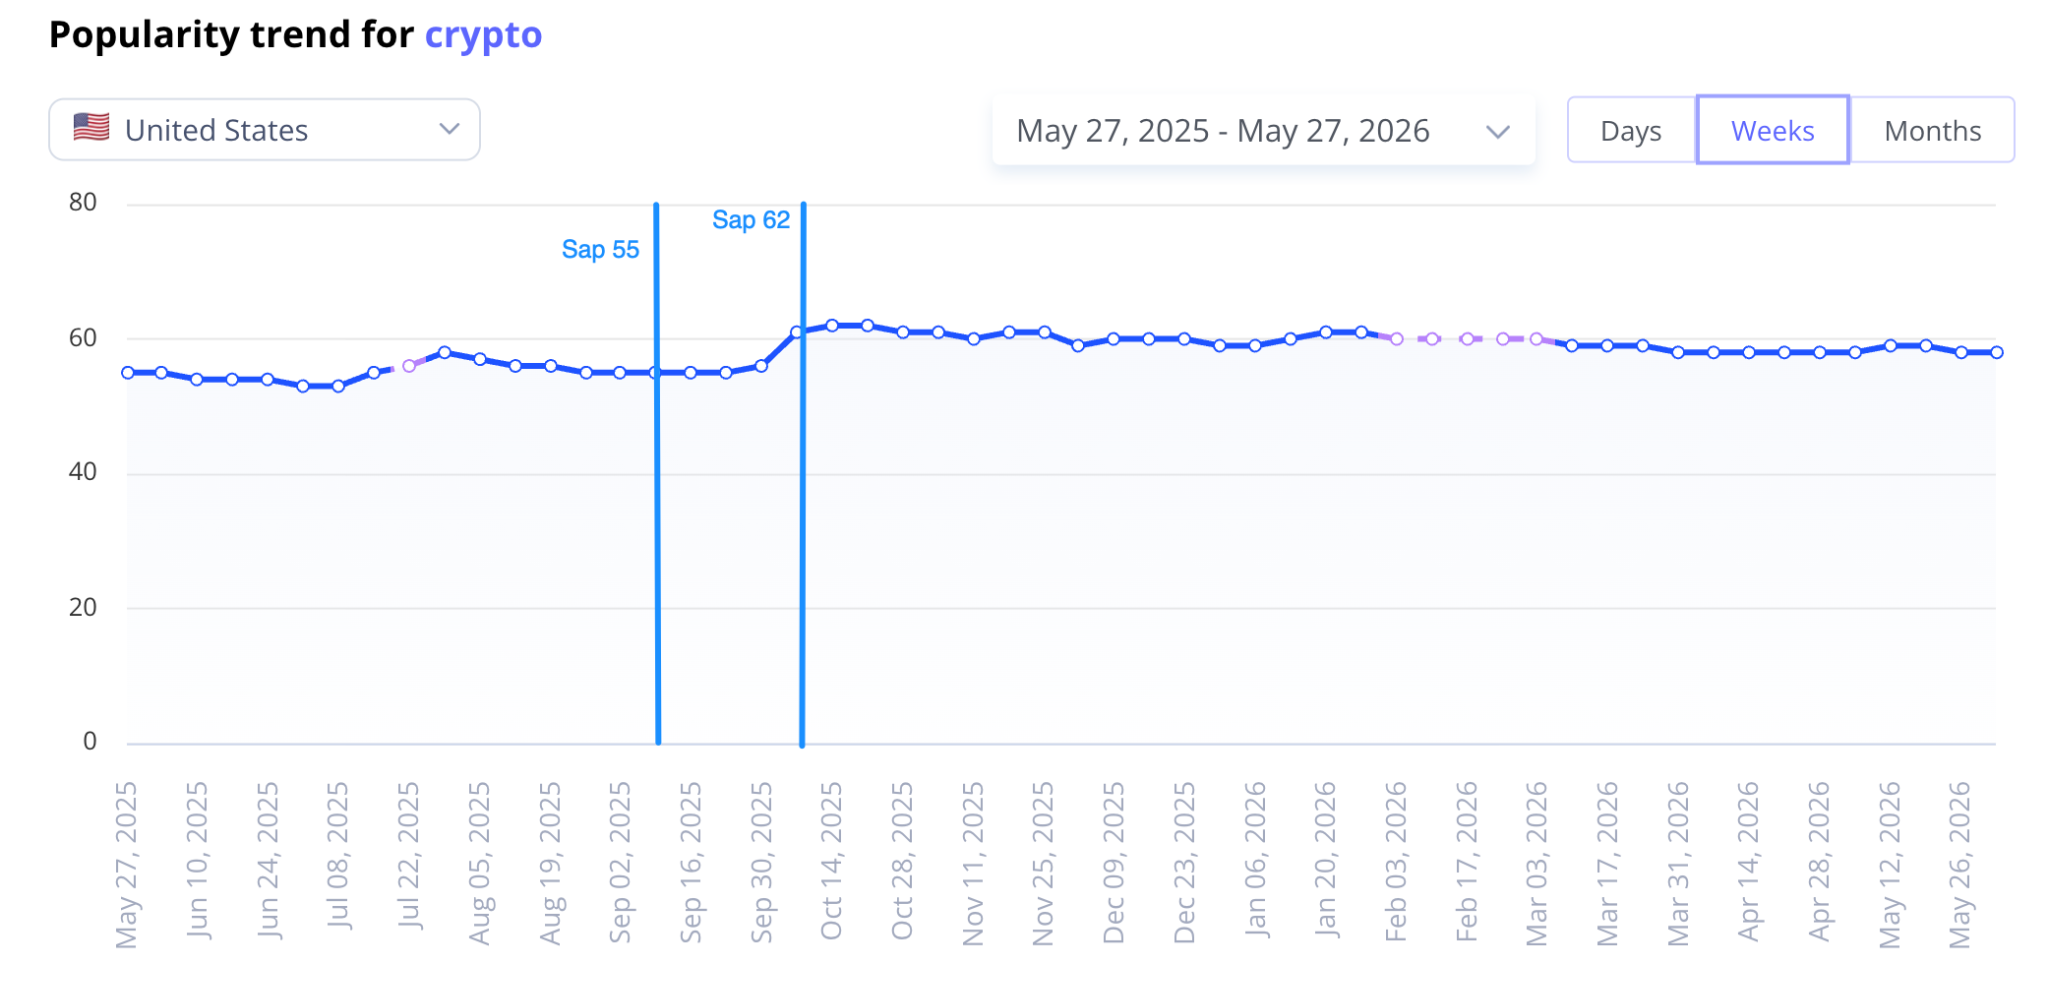
During this period, Bitcoin experienced significant price volatility on a historic scale, and users were increasingly searching for crypto apps, currencies, and exchanges.
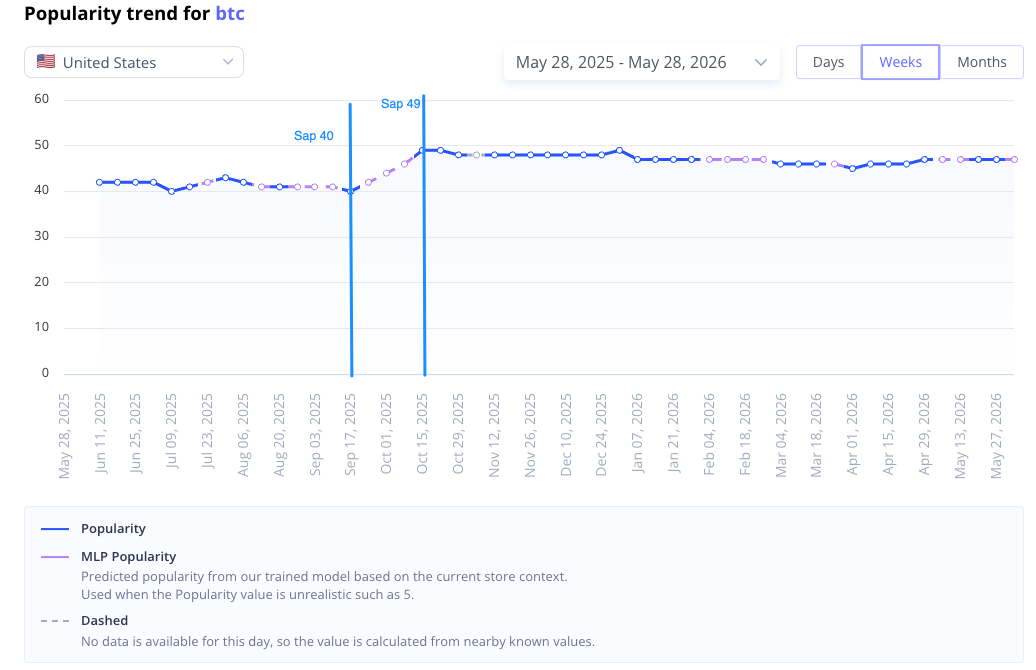
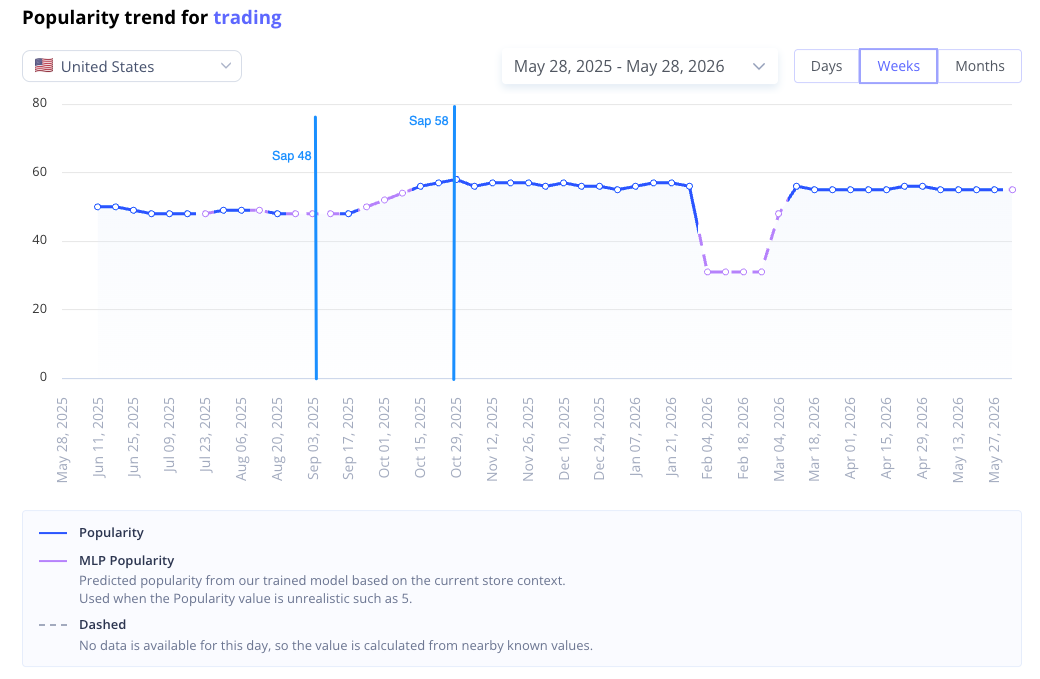
In other words, this is not classic calendar-based seasonality, but event-driven seasonality: demand increased in response to a specific market event.
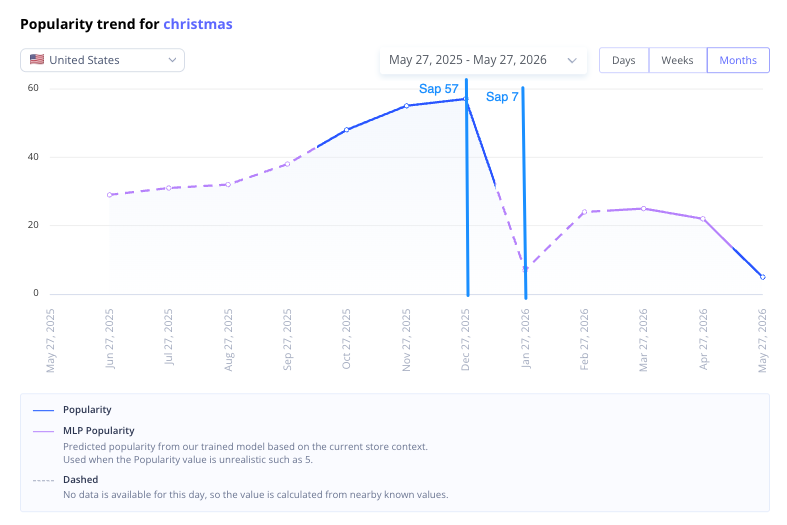
Holidays, global sales days, sporting events, and similar occasions also have a distinct impact on the seasonality of search terms. For instance, the SAP for “Christmas” increases to 57 in December.
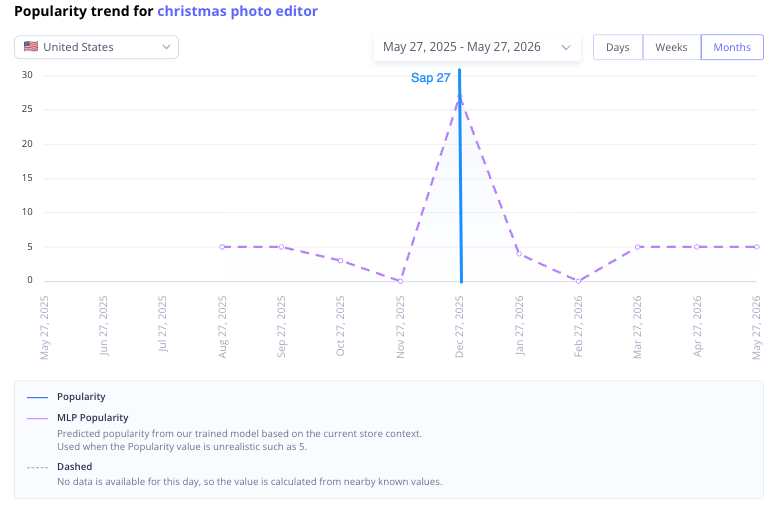
The SAP for “Christmas Photo Editor” rises to 27.
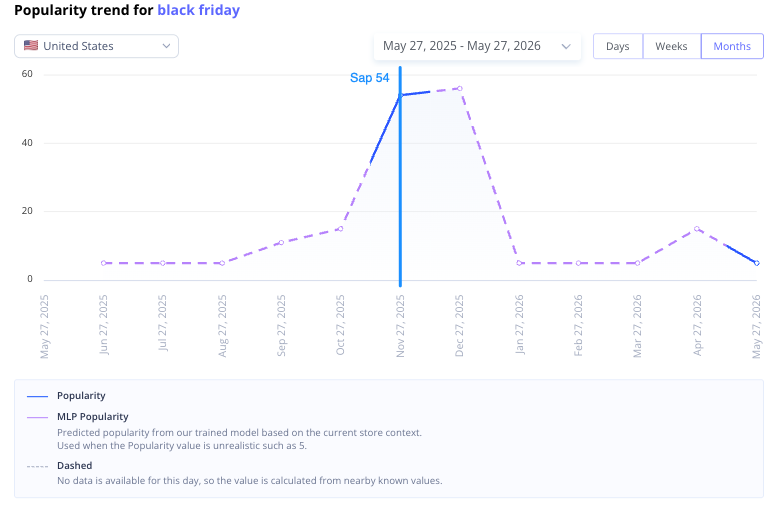
During the Black Friday period, the SAP rises to 54. However, outside this period, the search term is virtually unknown.
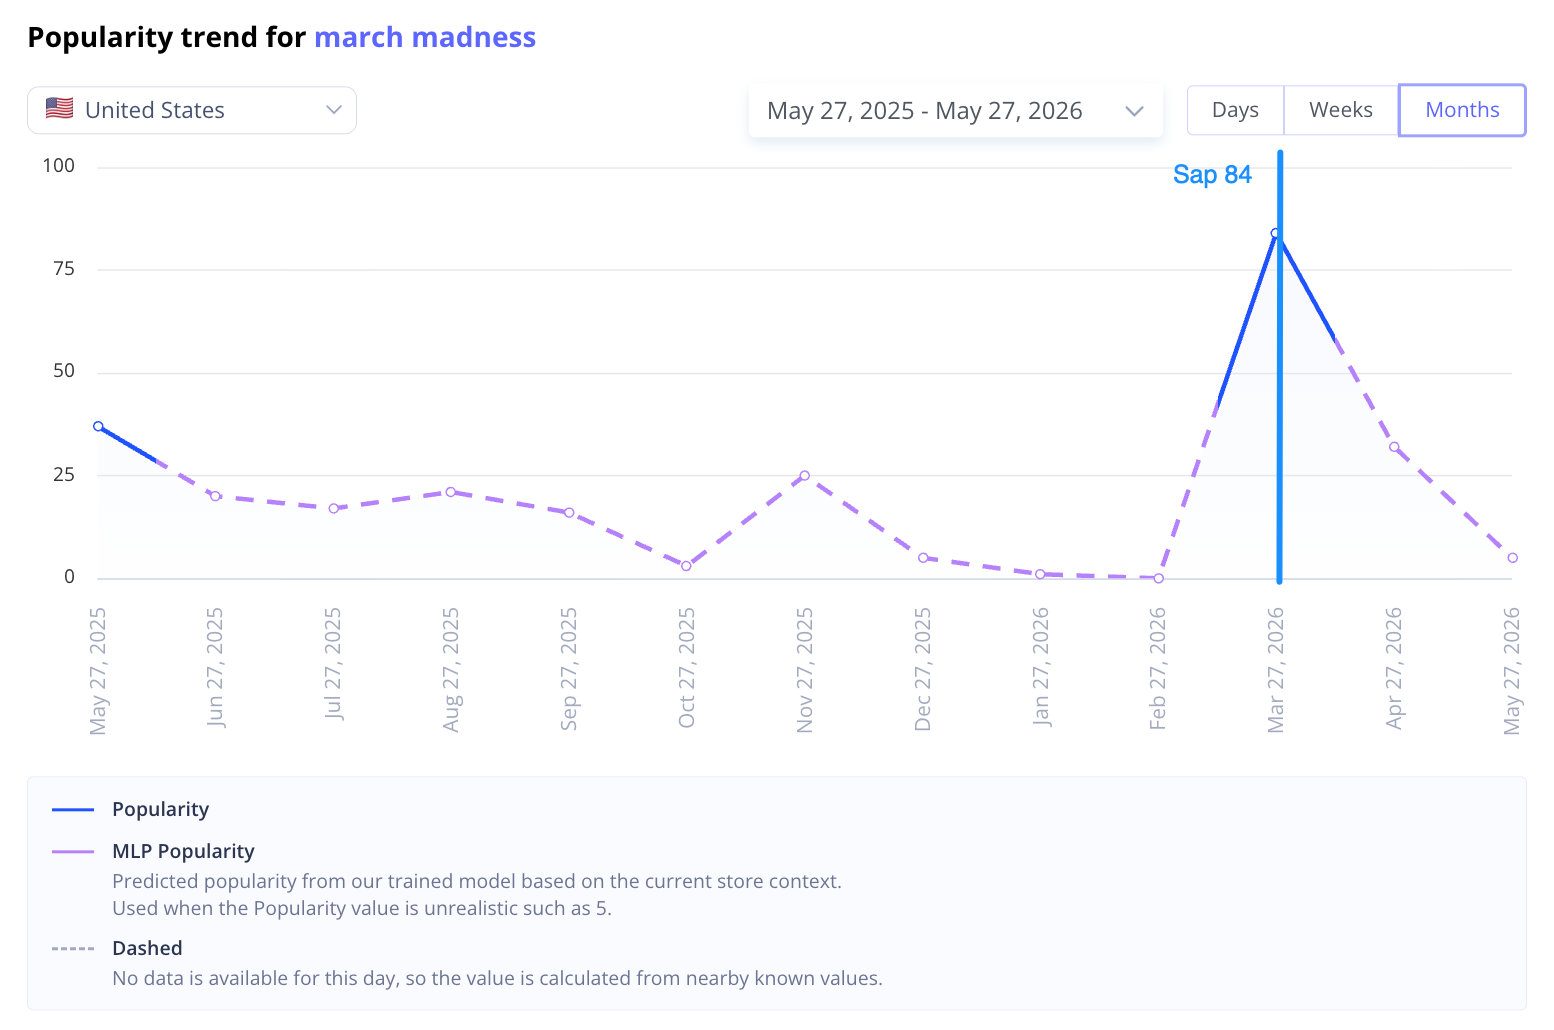
During March Madness in the U.S., search terms for apps that track results or stream games surge. The SAP reaches 84 during the tournament.
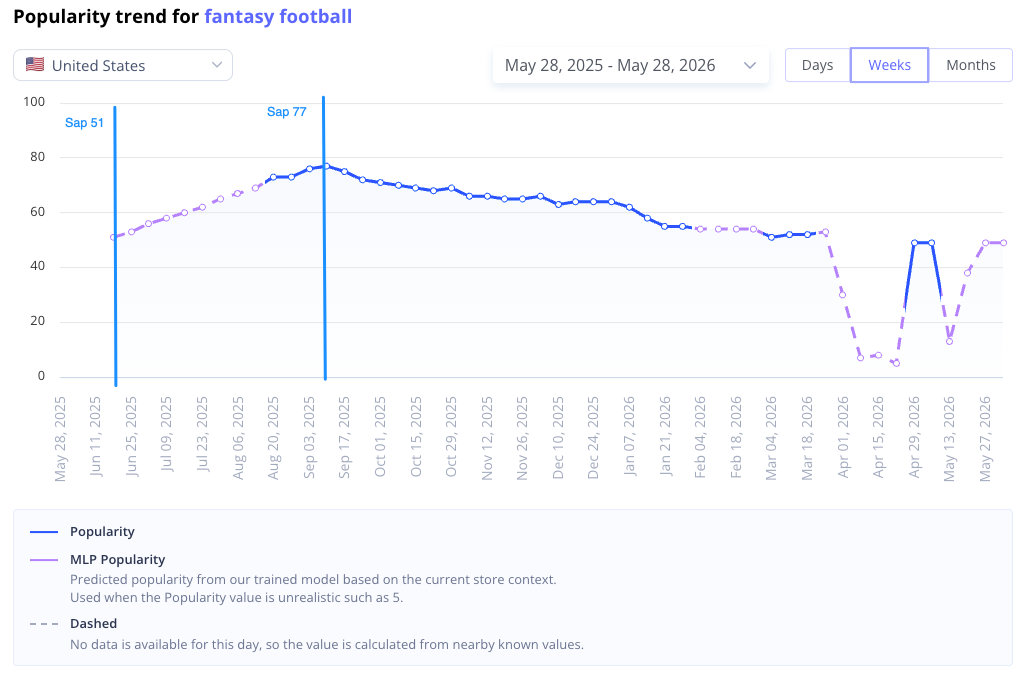
Search interest in “Fantasy Football” rises from 51 in the summer to 77 in September, coinciding with the start of the NFL season.
Seasonality doesn’t always manifest as an obvious peak during the holidays. It can also be driven by academic cycles, sporting events, market news, or shifts in user intent within a single niche. That’s why seasonal ASO analysis should start not with the calendar, but with the historical popularity of individual search terms.
Before entering the market, it’s important to understand:
This should not be an additional “after-the-fact” check, but a core part of niche analysis and future marketing strategy.
It’s also worth considering the season in which the app will launch. Launching during high season may generate more initial traffic, but competition for users’ attention will also be significantly stronger. Launching during the low season may provide a less competitive environment for testing positioning, metadata, and creatives, but initial demand is likely to be lower.
Therefore, the release season directly impacts initial impressions, downloads, conversion rates, and expectations for marketing performance.








.avif)