Crypto Wallet Promotion via Google Ads: How to Get Certified in 12 Countries and Attract 300,000 Users

Service:
Sector:
Banks & Finances
Author:
Published:
July 23, 2025
Team:
Oleksandr Vasyliev
User Acquisition Specialist
Tetiana Ilienko
Project Manager
Anna Havrylova
User Acquisition Specialist at RadASO
Nikolay Nishchenko
Business Development Manager
"

Introducing Our Partner

IronWallet is a cold cryptocurrency wallet that supports over 10,000 digital assets. The application provides offline storage of cryptocurrencies, ensuring maximum security for your crypto holdings.

Collaboration Goals

The company encountered a Google Ads account suspension, putting a critical user acquisition channel at risk. An urgent solution was needed to resume advertising activities. As a certified Google Ads partner, we leveraged our relationship with dedicated account managers to expedite the resolution process.

Our goals:

  • Obtain Google Ads certification to promote the app across all eligible regions.
  • To attract new users as quickly as possible.

To achieve this, we developed a three-stage action plan: 

  1. Analyze the causes of the account suspension.
  2. Obtain advertising certification.
  3. Launch advertising campaigns.

Step 1. Analyze the Causes of the Account Suspension

The first step was to identify the reasons for the sanctions imposed on the advertising account. We conducted a thorough audit of the account and its advertising activities to pin point the violations that triggered the restrictions imposed by Google Ads.

In parallel, we developed a phased action plan:

  • If unblocking the original account was not possible, we proceeded to create a new advertising account.
  • To restore ad impressions, we obtained Google Ads certification separately for each country. This enabled us to quickly resume advertising campaigns and minimize downtime in user acquisition.

Step 2. Obtaining Ads Certification

We conducted an in-depth study of Google's policies on promoting cryptocurrency wallets and financial services, including country-specific restrictions and advertiser requirements.

Next, we identified the necessary certificates and licenses required to run ads in each priority region.

Based on this, we prepared a comprehensive package of documents and submitted certification applications. Each application was tailored to the specific requirements of the region to improve the chances of approval.

Step 3. Launch Advertising Campaigns

After obtaining all the necessary certificates, we proceeded to launch the advertising campaigns. We developed creatives in line with Google Ads requirements, ensuring each ad was internally reviewed for compliance with the platform’s policies.

Immediately after the launch, we began A/B-testing various formats, messages, and target audiences. The most effective ads were scaled up, while underperforming ones were updated or discontinued.

The promotion spanned 12 countries. Regular performance analysis and timely campaign adjustments contributed to a consistent improvement in efficiency.

Discover how new graphics and A/B testing on the App Store and Google Play brought Shkaf 4 times more organic downloads.
Campaign
Expenditure
Impressions
Taps
Installs
TTR
CR
Installs/Impr
Avg CPT
Avg CPA
Common term
-65.64%
-49.85%
-64.01%
-63.52%
-1.69%
0.81%
-0.98%
-5.13%
-6.06%
Data collection
-44.45%
-29.55%
-44.22%
-50.2%
-0.7%
-6.39%
-0.6%
0%
11.65%
Competitors brand
98.56%
80.41%
103.76%
92.01%
0.38%
-3.58%
0.12%
-2.38%
2.94%
Our brand
21.39%
23.01%
33.84%
32.65%
3.14%
-0.72%
2.27%
-8.33%
-6.82%
Discovery
-100%
-100%
-100%
-100%
-3.61%
-30.16%
-1.09%
-100%
-100%
Total
-0.6%
7.92%
11.72%
12.3%
0.2%
0.35%
0.16%
-11.36%
-12.31%
Group
Spend, $ %
Impressions %
Taps %
Installs %
Installs/Impr October, %
Installs/Impr November, %
Installs/Impr %
Avg CPT, $ %
Avg CPA, $ %
Competitor 1
42,98
83,11
63,3
50,48
3,74
3,08
-0,66
-12,2
-5,66
Common term
3,26
-3,73
3,92
26,67
0,57
0,75
0,18
0
-18,8
Competitors brand
120,26
59,82
47,02
0
0,49
0,31
-0,18
47,37
119,4
Data collection
15,12
-0,55
0,36
73,33
0,5
0,86
0,36
13,73
-33,51
Competitor 2
0,27
13,2
8,47
10,11
1,12
1,09
-0,03
-6,56
-9,02
Competitor 3
21,51
-2,06
-6,67
-8,33
0,43
0,4
-0,03
32
32,95
Our brand
3 575,62
3 646,79
3 544,9
3 553,66
37,61
36,68
-0,93
0
0
Competitor 4
-29,36
-35,77
-24,07
-33,7
0,61
0,63
0,02
-7,46
6,25
Relevant Competitors
69,42
26,03
51,35
48,95
6,3
7,45
1,15
12,2
14,29
Competitor 5
32,21
17,63
57,48
53,16
1,71
2,23
0,51
-15,71
-13,77
Competitor 6
-9,31
9,42
22,92
17,89
5,3
5,71
0,41
-27,08
-23,44
Total
33,96%
13,44%
87,29%
127,08%
1,36%
2,73%
1,37%
-29,09%
-40,74%
Custom region
Impressions
Units
1/7/2021 - 1/15/2021
1/16/2021 - 1/24/2021
Change
%
MoM
1/7/2021 - 1/15/2021
1/16/2021 - 1/24/2021
Change
%
MoM
United States
12 970
39 436
26 466
204 %
88 220
1 116
1 904
788
71 %
2 627
UK + Ireland
8 731
10 197
1 466
17 %
4 887
438
462
24
5 %
80
Germany + AT + CH + LU
1 974
6 235
4 261
216 %
14 203
203
291
88
43 %
293
France
1 500
4 390
2 890
193 %
9 633
182
237
55
30 %
183
Netherlands / Belgium
1 593
3 599
2 006
126 %
6 687
159
201
42
26 %
140
Ukraine
697
4 010
3 313
475 %
11 043
85
189
104
122 %
347
Canada
2 569
3 614
1 045
41 %
3 483
145
178
33
23 %
110
Northern Europe
1 273
2 024
751
59 %
2 503
117
175
58
50 %
193
Australia + NZ
1 754
3 324
1 570
90 %
5 233
137
160
23
17 %
77
Vietnam
352
2 712
2 360
670 %
7 867
32
144
112
350 %
373
Thailand
679
2 016
1 337
197 %
4 457
57
142
85
149 %
283
Arabic World
268
1 745
1 477
551 %
4 923
40
119
79
198 %
263
Spain
844
2 058
1 214
144 %
4 047
78
108
30
38 %
100
Eastern Europe
458
1 070
612
134 %
2 040
63
95
32
51 %
107
Italy
826
2 145
1 319
160 %
4 397
77
94
17
22 %
57
Turkey
338
2 309
1 971
583 %
6 570
34
87
53
156 %
177
Rest of World
426
1 457
1 031
242 %
3 437
48
81
33
69 %
110
Japan
553
5 113
4 560
825 %
15 200
18
80
62
344 %
207
India
234
1 169
935
400 %
3 117
15
75
60
400 %
200
Brazil
294
1 332
1 038
353 %
3 460
34
67
33
97 %
110
Hispanic America
318
784
466
147 %
1 553
42
51
9
21 %
30
Indonesia
206
525
319
155 %
1 063
20
41
21
105 %
70
Korea (South)
308
2 055
1 747
567 %
5 823
22
36
14
64 %
47
Malaysia
119
663
544
457 %
1 813
11
27
16
145 %
53
Taiwan + HK + Macau
145
532
387
267 %
1 290
9
24
15
167 %
50
Rest of Europe
82
287
205
250 %
683
12
22
10
83 %
33
Portugal
17
273
256
1 506 %
853
2
18
16
800 %
53
Israel
23
120
97
422 %
323
3
9
6
200 %
20
China / Singapore
78
134
56
72 %
187
6
7
1
17 %
3
Total
39 629
105 328
65 699
166 %
218 997
3 205
5 124
1 919
60 %
6 397

Results

In five months of active promotion, we achieved consistent growth in key metrics and significantly enhanced the effectiveness of our advertising campaigns:

  • Installs — over 300 000.
  • Reduction in download costby 266% compared to the starting point.
  • Active campaigns — obtained certificates and launched advertising in 12 countries.
Graph of app installs from September 2024 to January 2025.

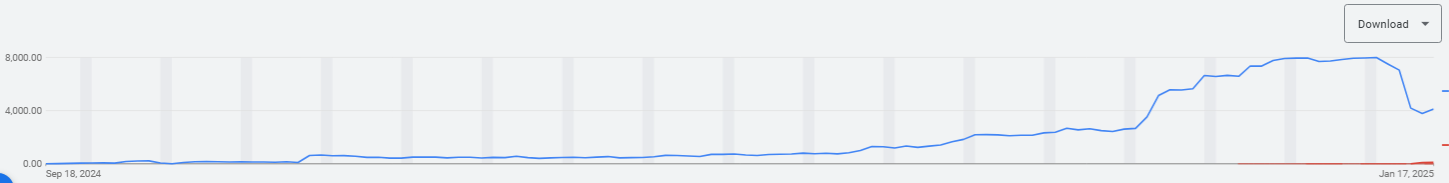
These strong results were made possible by a flexible promotion strategy, close collaboration with our partner, and continuous analysis of advertising campaign effectiveness.

Feedback on Cooperation

Oleksandr Vasyliev, User Acquisition Team Lead в RadASO

Prompt communication from the partner enabled us to submit all necessary documents without delay, significantly speeding up the certification process. Thanks to this well-coordinated effort, we were able to launch advertising quickly.

More Case Studies

Home
Up
Boost Your App
Please fill in the form below and we'll call you back in no time.
Your request has been received! We'll be in touch shortly
Oops! Something went wrong while submitting the form.