For fashion retailers, a mobile app is more than just another sales channel — it’s a familiar and convenient way to engage with their audience. However, even a strong brand can remain invisible without effective ASO.
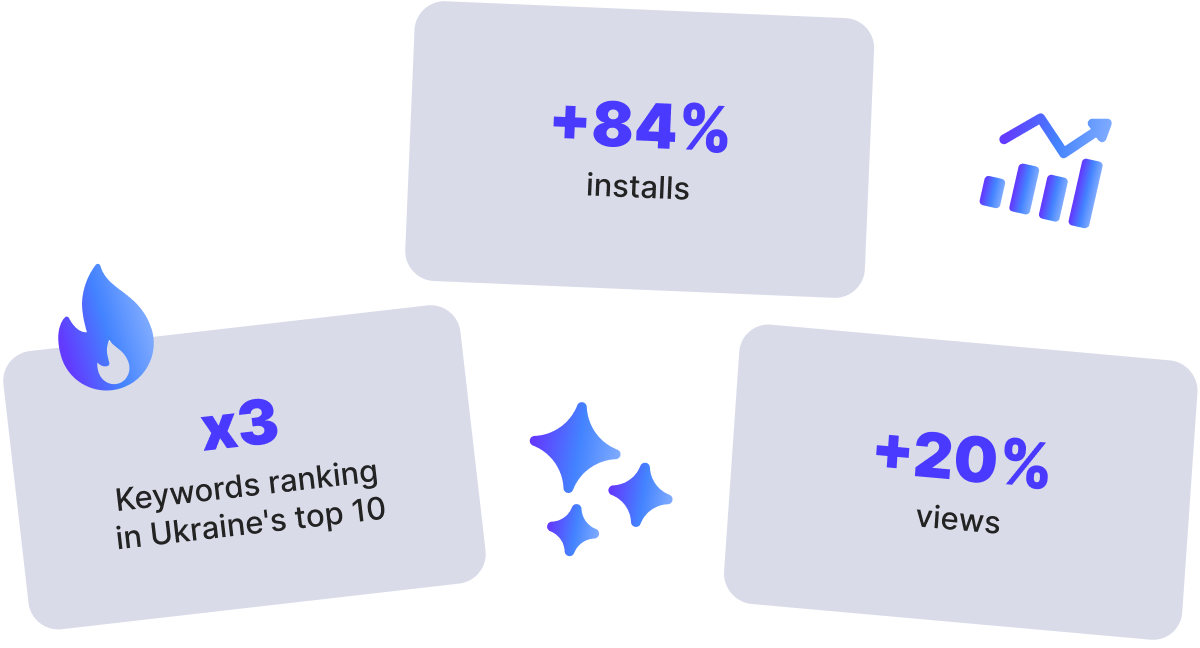
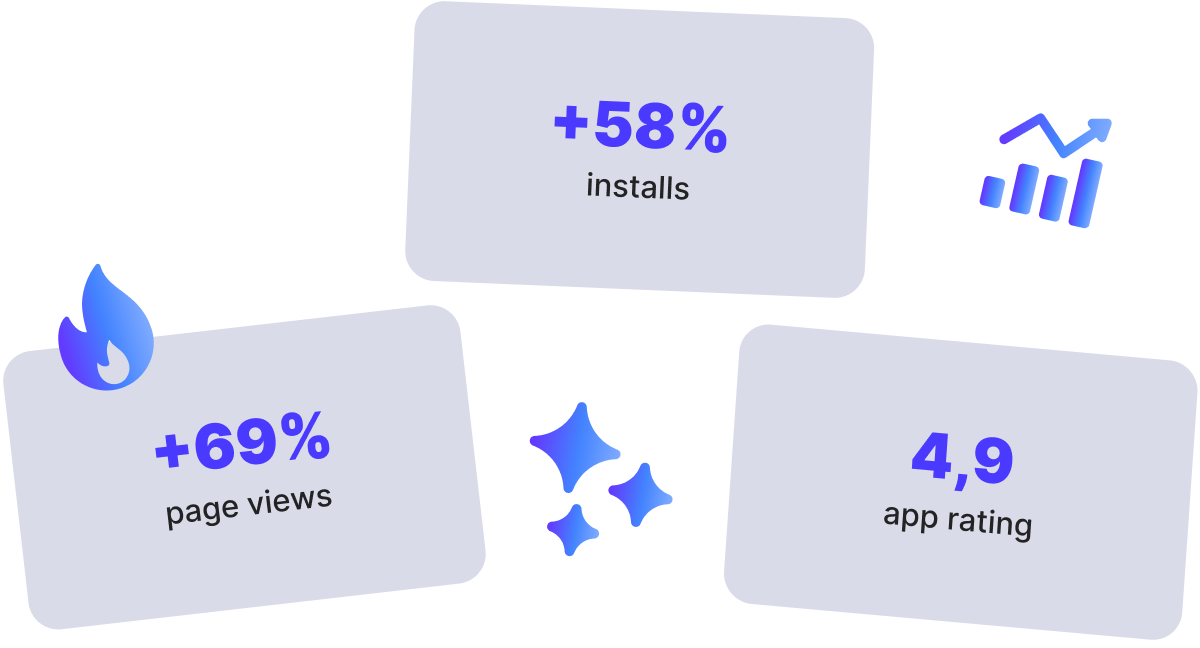
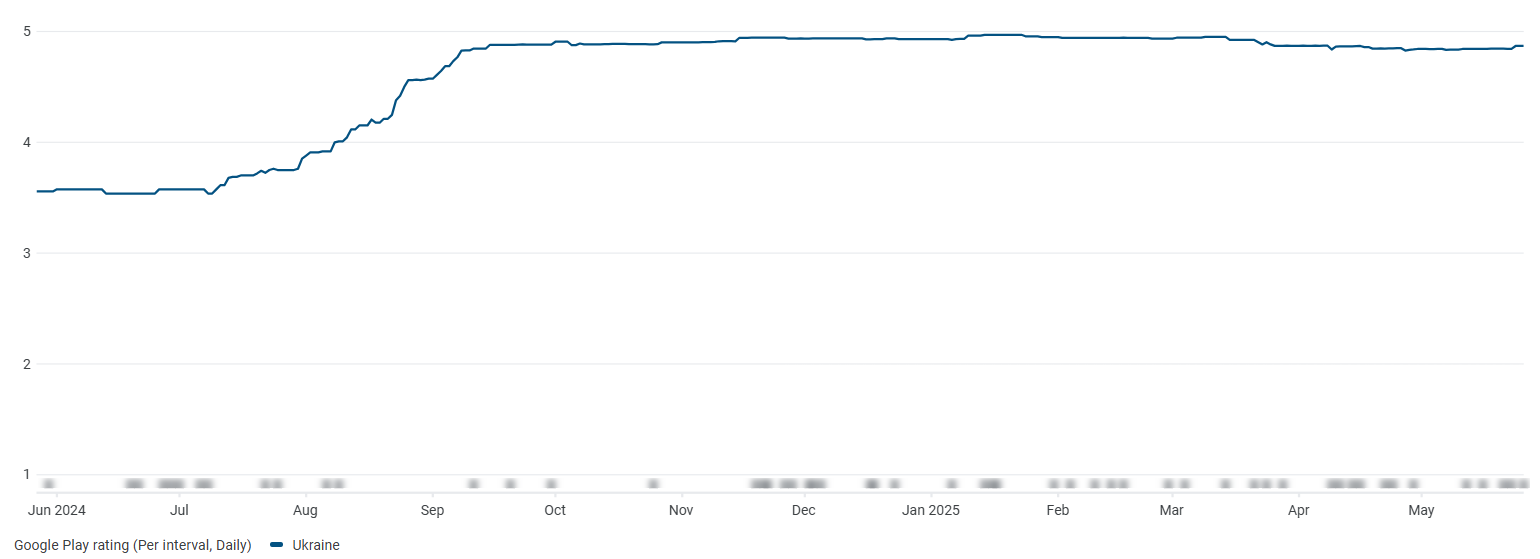
In this case study, we share how we helped a multi-brand clothing and footwear retailer enhance its app visibility, nearly double organic installs, and raise its rating from 3.6 to 4.9 through optimization, seasonal campaigns, and targeted user communication.
A multi-brand retailer of clothing, footwear, and accessories with both online and offline operations.
The company has long been established in the Ukrainian market, but its mobile app had not reached the expected level of popularity. Since mobile apps are a key channel for fashion retailers, the partner chose to focus on promoting it in the App Store and Google Play.
Our goals:
We divided the work into several key steps to address everything from keyword optimization to performance evaluation and ratings:
At the first stage, we identified relevant keywords ключевые слова and assessed their popularity. We also analyzed how competitors approach text optimization, focusing on three groups:
Next, we prepared metadata for three locales indexed in Ukraine: English (UK), Ukrainian, and Russian, applying a tailored approach for each site.
In the App Store:
In the Google Play:
In the App Store, we regularly updated metadata (once or twice a month) to test different combinations. We kept the ones that consistently placed the app in the top 10; as for those that turned out to be ineffective, we decided to replace them.
In Google Play, we set up Custom Store Listings for branded keywords and updated the description to target a broader range of search terms.
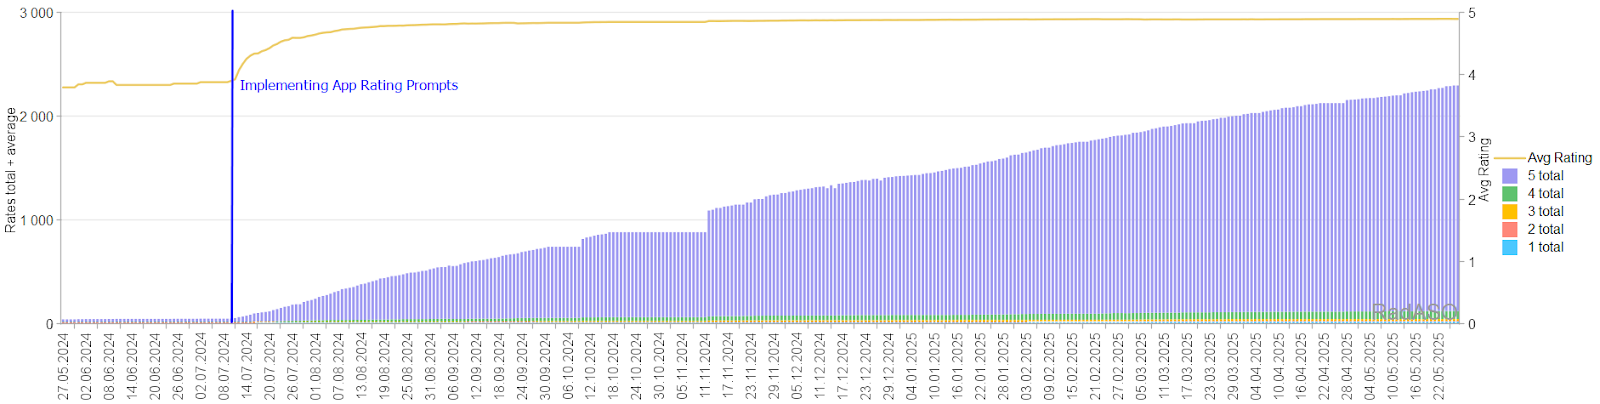
We proposed options for placing rating prompts in the app, taking two key factors into account:
Throughout the year, we adapted metadata and Custom Store Listings to align with seasonal events in the niche — from back-to-school and Halloween to Black Friday. This approach helped maintain relevance and reinforced the app’s position in search results.
Read how new screenshots and descriptions on Google Play increased conversion by +12.8% — COMFY Case Study.
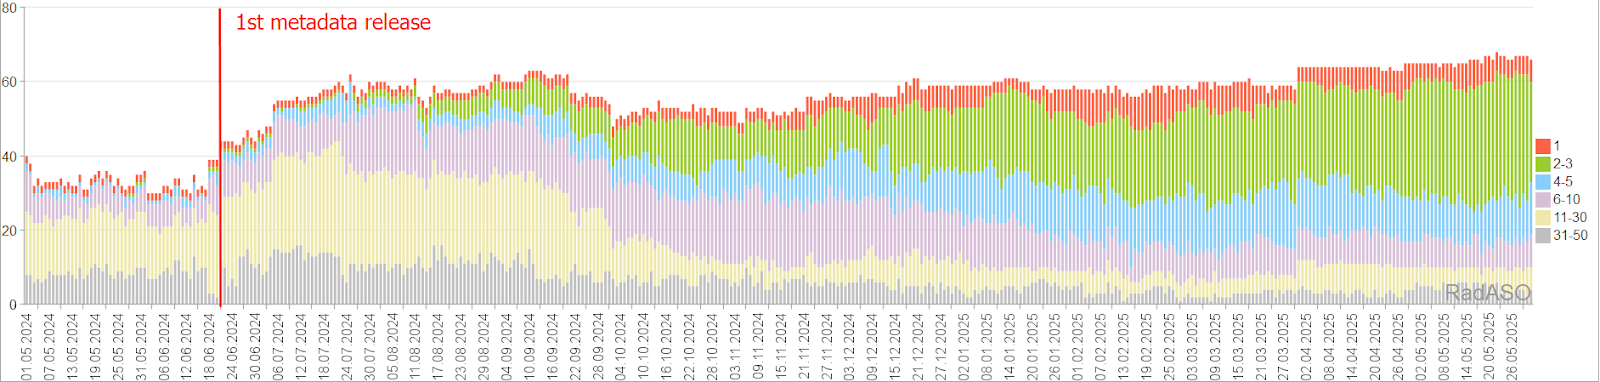
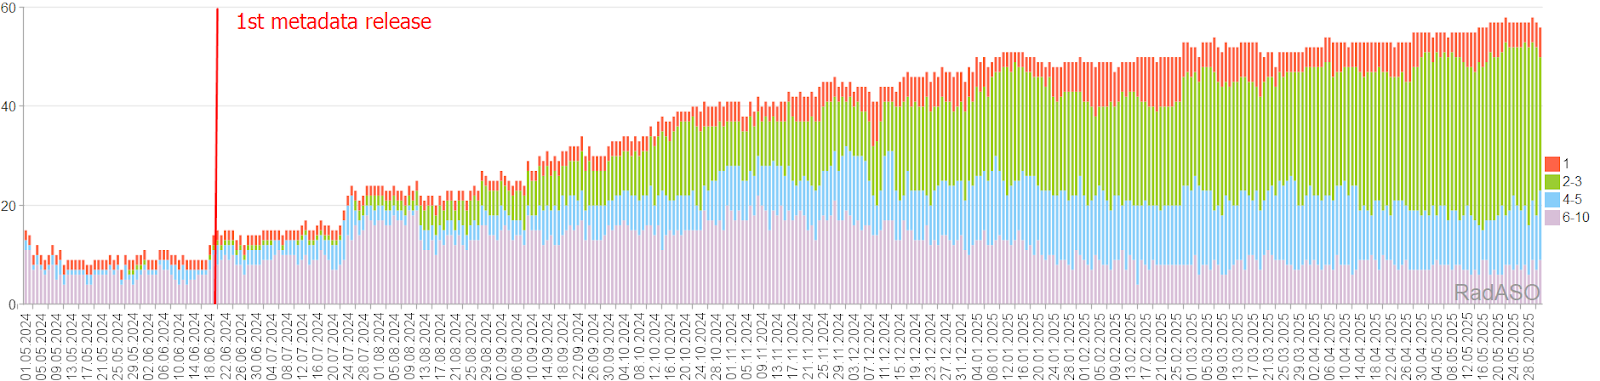
Trends in the number of keywords in the Top 10 in the App Store
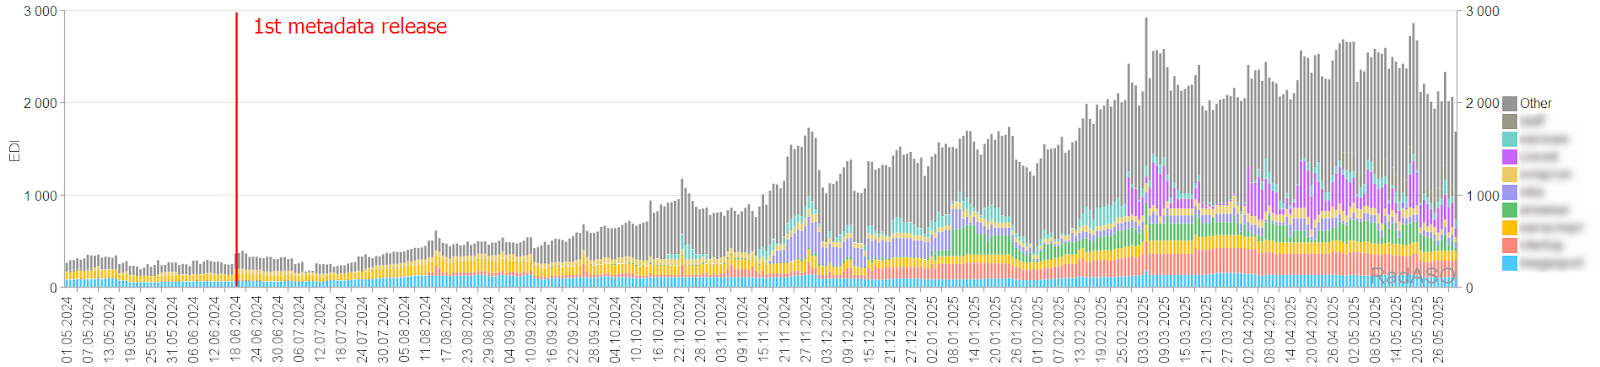
On Google Play, organic traffic comes from two main sources:
We compiled the results in a table, presenting the dynamics for Google Play Search and Google Play Explore separately.
Over the course of a year, the app has become more visible in search results, gained more downloads, and achieved steady growth. We continue to focus on its development by monitoring changes in demand, tracking new keywords, aligning with seasonal events, and testing visual elements — all aimed at strengthening our position and expanding the brand’s market share.


.avif)