Scaling ASO in a Niche Market Without Paid Ads: +1169% Impressions and +631% Downloads in the App Store in 3 Months

Service:
Sector:
Shopping
Author:
Published:
January 14, 2026
Team:
Iryna Kuznietsova
ASO Specialist
Oleksii Volkov
Project Manager
Khrystyna Bereziak
ASO Specialist at RadASO

Even in a niche market with a limited keyword pool and where organic growth is usually very slow, it is possible to dominate without an advertising budget.

In this case study, we show how a systematic ASO strategy helped our partner overcome these limitations through localization expansion and graphics updates. Read on for the details.

"

About the Partner

Aromoshelf is a mobile app for perfume enthusiasts that allows users to build their own personal fragrance collection, record scent impressions, and discover new scents through smart recommendations.

Goals and Challenges

The partner approached us with the goal of scaling the product through ASO.

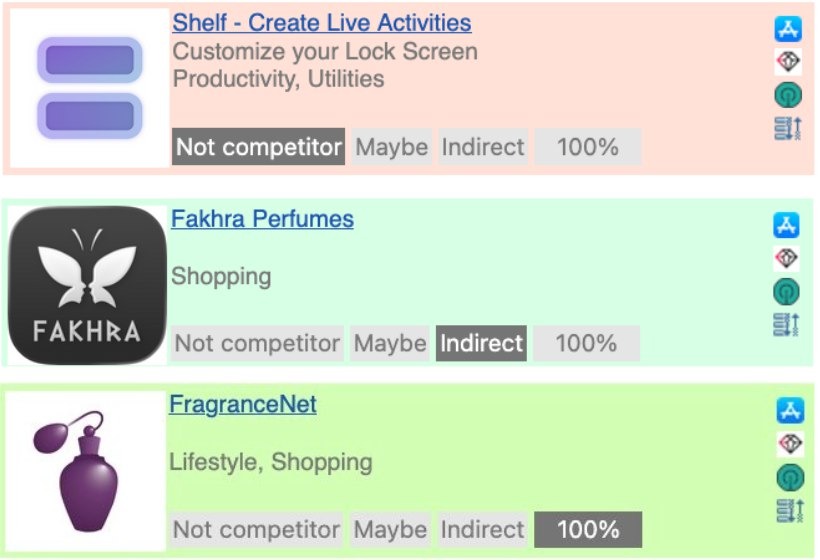
The main challenge was the app’s narrow niche and limited number of direct competitors, which significantly constrained the semantic core and complicated metadata preparation. The market lacked relevant generic keywords, and in the English (U.S.) locale, the initial semantic base effectively consisted of only three core terms: perfume, fragrance, and scent.

We defined three key objectives:

  1. Increase app visibility
  2. Grow organic installs
  3. Expand the active user base

Our Strategy

To scale Aromoshelf’s visibility and drive more organic installs, we built a step-by-step strategy:

  1. Analyze the market and competitors to identify growth opportunities.
  2. Build a comprehensive semantic core and update metadata to improve visibility and conversion.
  3. Scale localizations and regularly optimize keywords to improve rankings and secure positions.
  4. Strengthen the app’s visual presence by updating screenshots and adapting messaging to audience expectations.

Step 1. Market and Competitor Analysis

At the initial stage, we analyzed competitors’ metadata structures, target keywords, screenshot design, and the countries generating the highest levels of organic traffic.

This analysis allowed us to identify growth opportunities and select priority markets for our partner.

Initially, the Aromoshelf team planned to focus exclusively on the U.S. market. However, niche analysis revealed greater scaling potential, so we recommended expanding to additional regions.

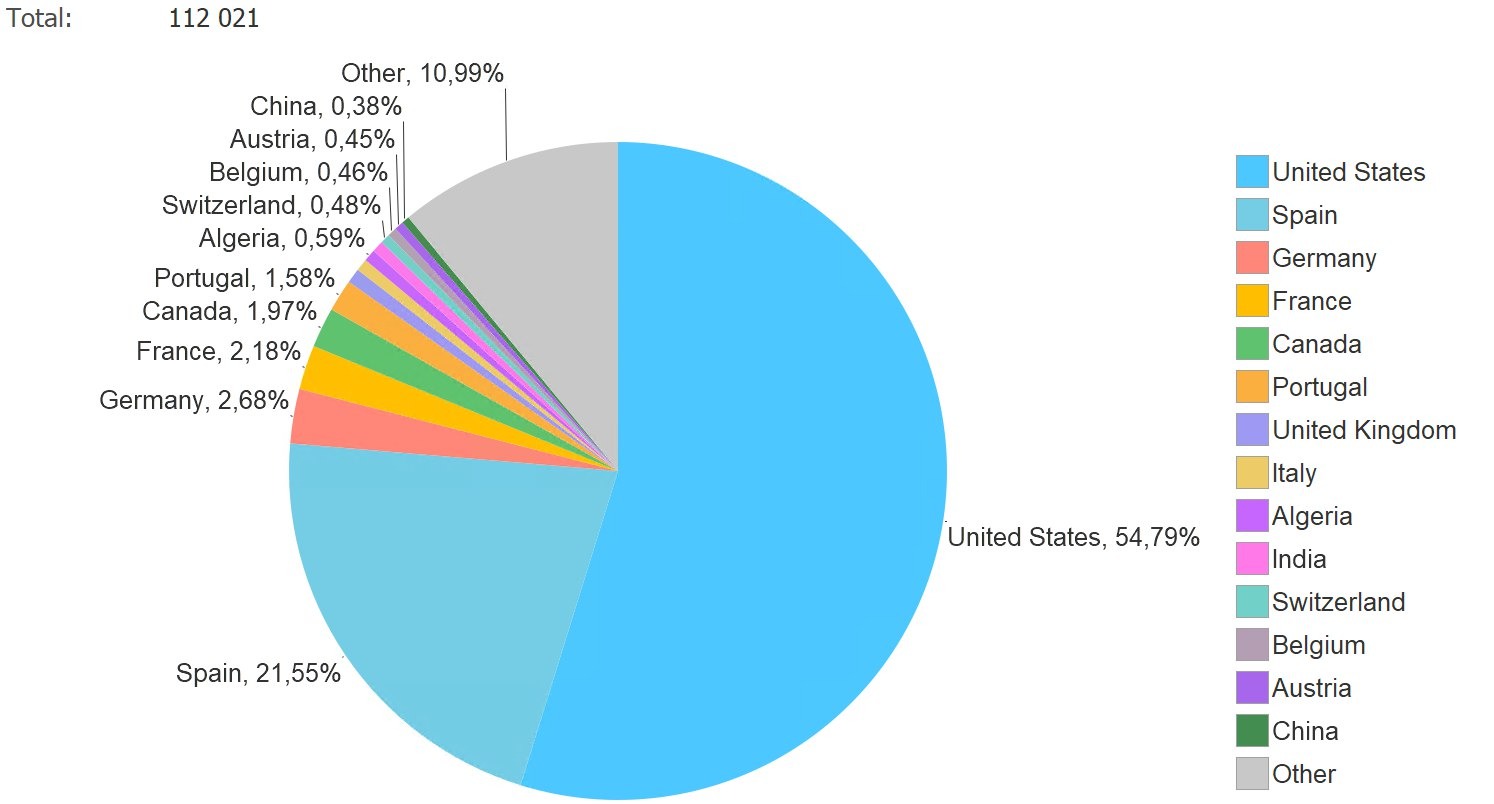
As a result, we identified the TOP-3 priority markets: the United States, Spain, and Germany.

For the first iteration, we selected four locales indexed in the U.S.:

  • English (U.S.)
  • Chinese (Traditional)
  • Korean
  • Vietnamese

The full list of cross-locales is available via the link.

Step 2. Building the Semantic Core and Creating Metadata

At the next stage, we built a comprehensive and high-quality semantic core.

  1. We analyzed both direct and indirect competitors, filtering out apps that were unrelated to the niche:

  1. After keyword analysis, we determined which search terms should be used in the Title and Subtitle to boost visibility and enhance page conversion.
  2. Based on the collected semantic core, we prepared the first version of metadata for the approved locales. For each locale, we selected the most popular and relevant keywords likely to attract the target audience. These keywords were strategically placed in the Title, Subtitle, and Keyword field to create logical connections and clearly communicate the app’s functionality.
  3. After publishing the updated metadata, we kept monitoring performance, implementing further optimizations, and expanding the number of locales available on average once per month.

During the first three months, we also optimized the following locales: English (U.K.), French, German, Spanish (Spain), Arabic, Italian, Dutch, Portuguese, and Chinese (Simplified).

The selection of locales was based on niche analysis and the volume of organic traffic in specific countries.

Step 3. Graphics Analysis and Hypotheses for Conversion Growth

After optimizing the metadata, we proceeded to improve the app page’s conversion rate.

We analyzed competitors’ visuals to identify common design patterns and assess the quality of their optimization. Additionally, we studied niche trends and target audience preferences to determine which messages and design styles most effectively influence install decisions.

Based on these insights, we formed a set of hypotheses to improve conversion, focusing on:

  • Updating screenshots
  • Revisiting the screenshot structure
  • Strengthening key messages

After presenting the hypotheses to the partner, we selected the strongest ideas for the first screenshot set. We focused on the app’s most valuable features, used simple and clear messaging, highlighted unique capabilities, and visually demonstrated how the app stands out from competitors.

Graphics in promoting mobile apps on the App Store and Google Play (ASO) — how to optimize graphic elements

Step 4. Developing a New Screenshot Set and Performance Monitoring

Based on the approved hypotheses, we prepared a detailed design brief that included:

  • Screenshot set structure
  • Screen order
  • Key messages and visual style
  • Requirements for composition, colors, and text


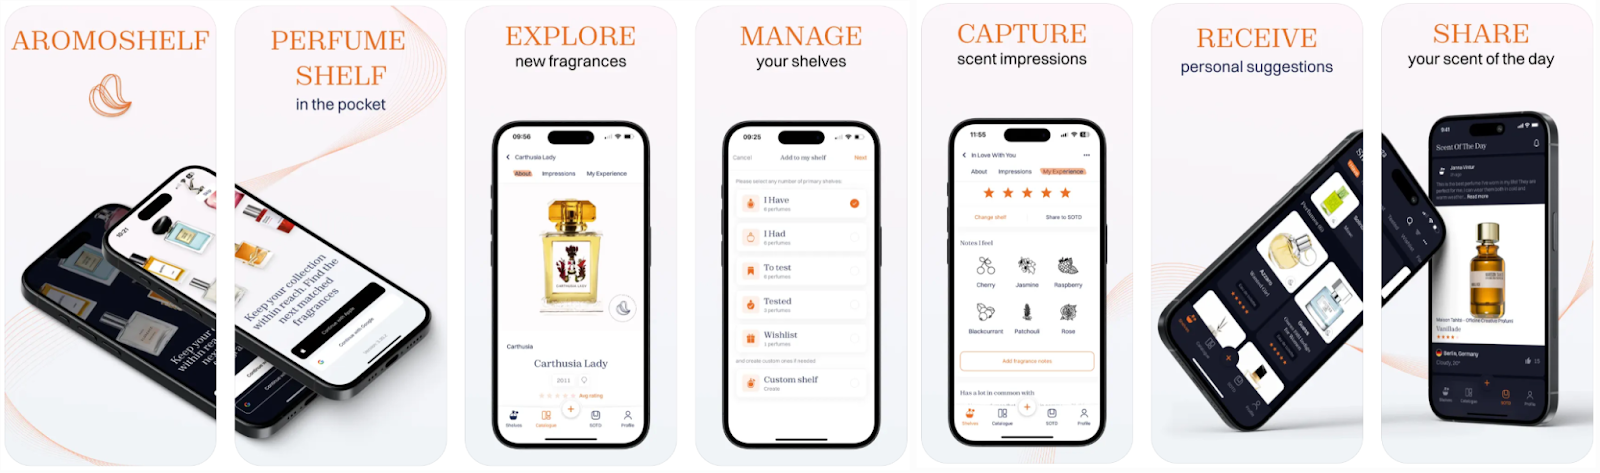
Initial screenshot set used as a baseline for updates:

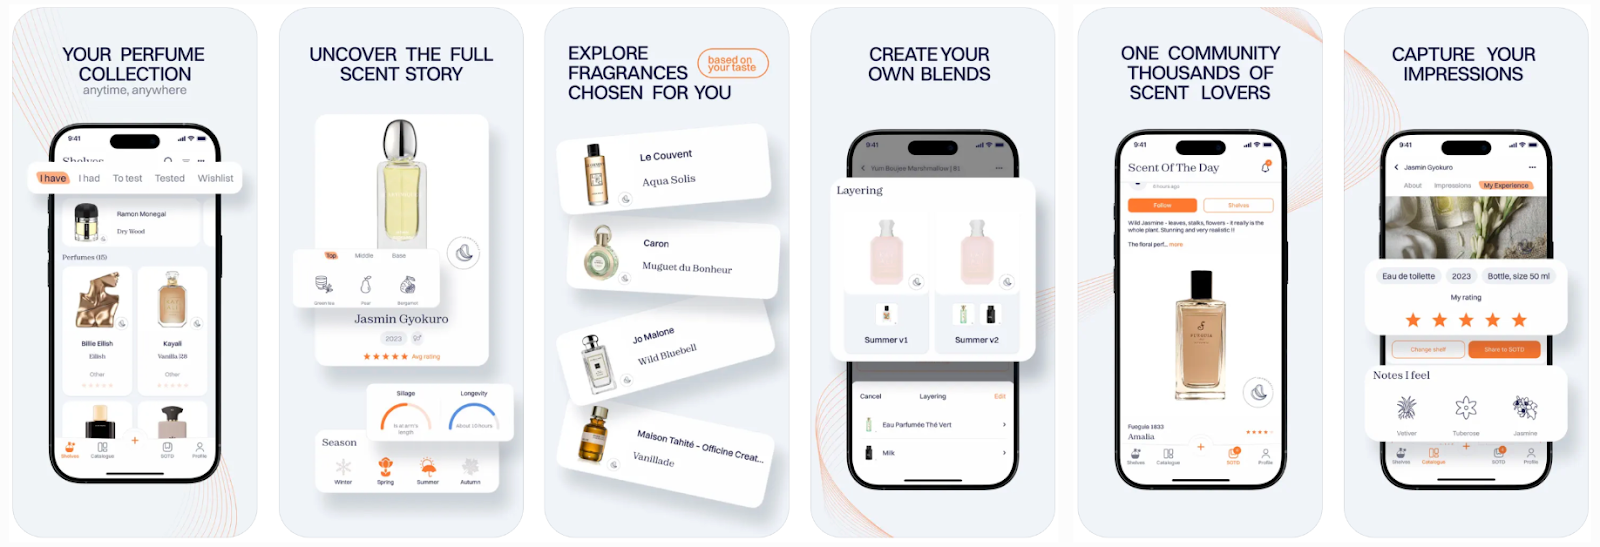
Updated screenshot set:

What we improved:

  1. Clearly showcased the app’s functionality and key features.
  2. Added zoom-ins on important UI elements.
  3. Created clear messages with soft CTAs.
  4. Highlighted personalized collections as a content personalization element.
  5. Rebuilt the screenshot sequence—from core features to secondary ones.
  6. Filled empty space with useful, informative details.
  7. Updated the background to a cooler tone based on competitor analysis.

After uploading the updated set, we began monitoring organic metrics—impressions, installs, and conversion rates—to assess the impact of the changes and define the next optimization steps.

Promotion Results

App Visibility Growth

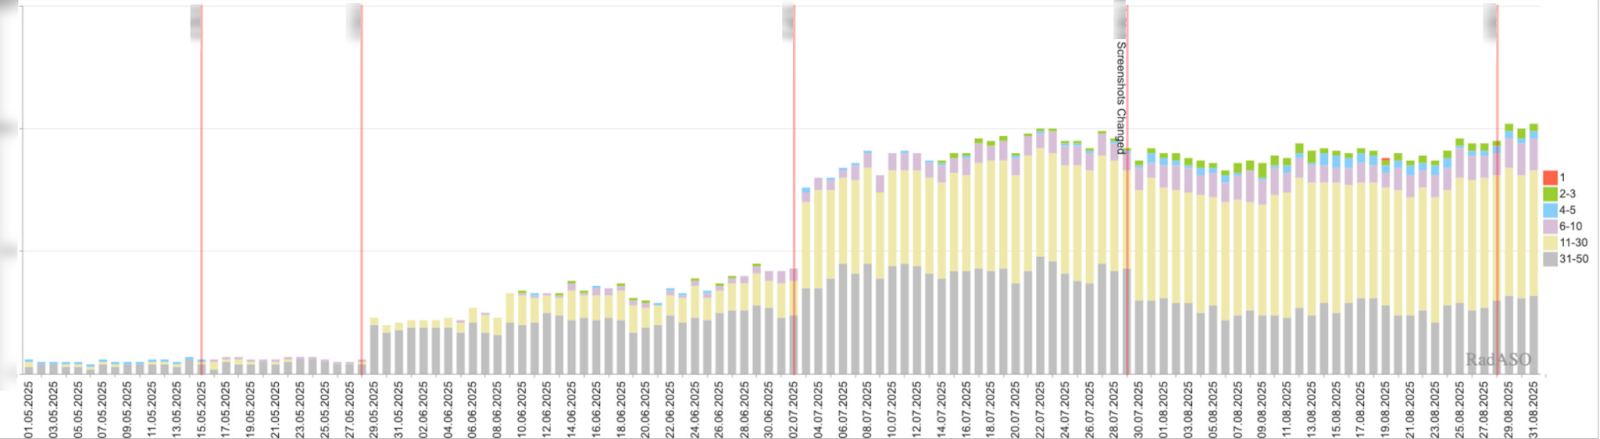
After optimizing metadata and scaling the number of locales available, the app’s search visibility began to grow steadily.

Dynamics of TOP-50 rankings across all countries:

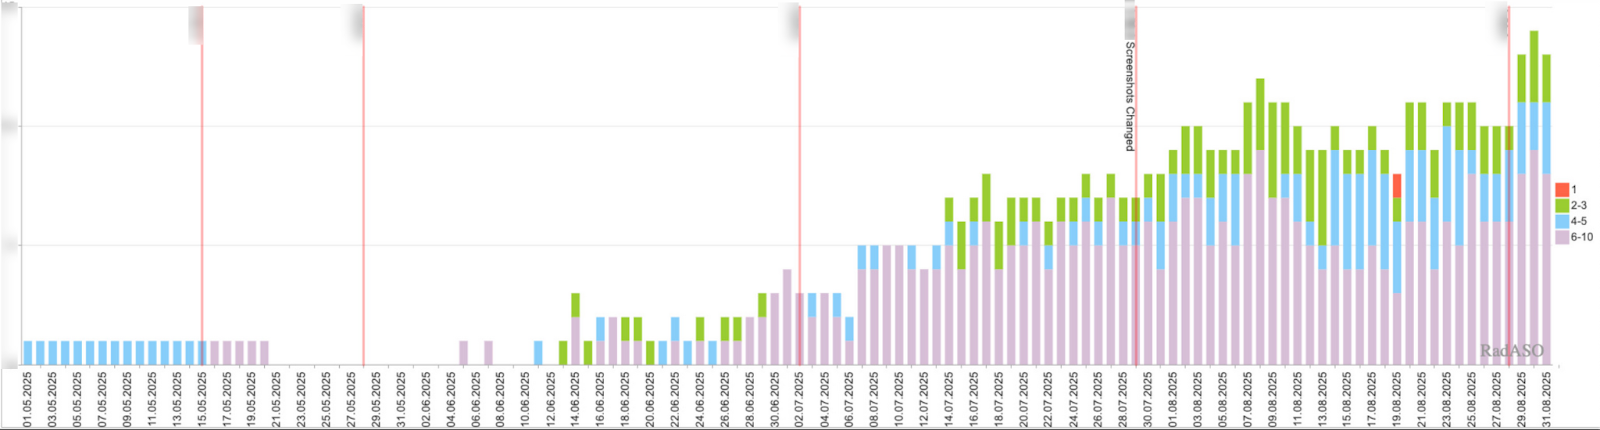
Dynamics of TOP-10 rankings:

Organic Traffic Growth

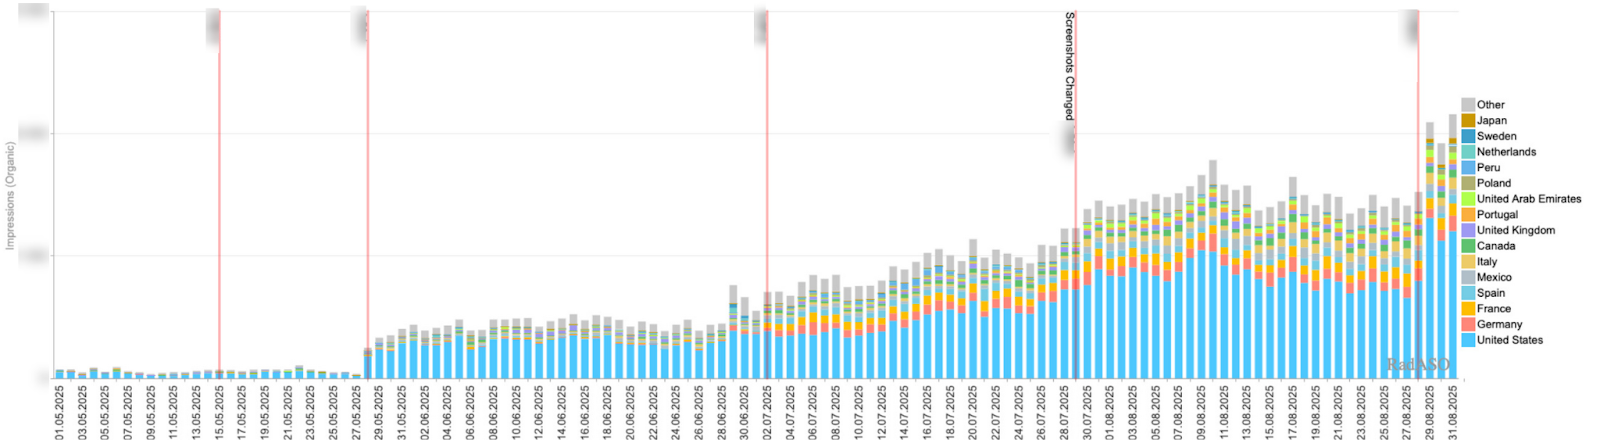
Improved visibility directly impacted organic impressions and installs.

Dynamics of organic impressions in target countries:

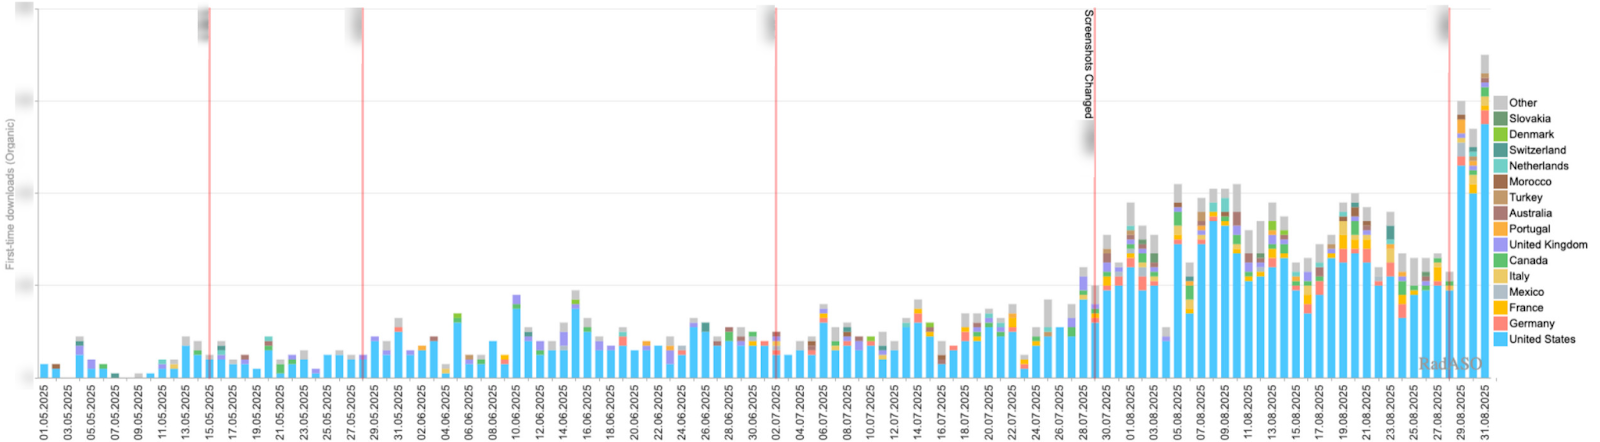
Dynamics of installs in target countries:

App Page Conversion Growth

The updated screenshot set had a significant impact on user behavior.

Organic conversion dynamics after the screenshot update:

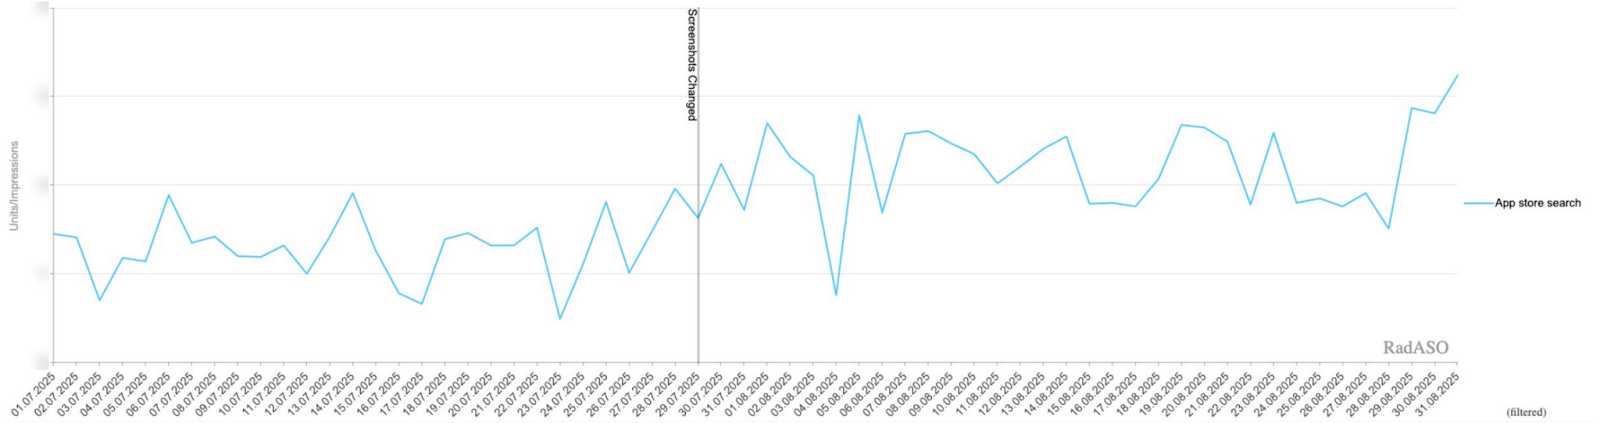
Comparison of App Store Search conversion one month before and after the update:

  • July 2025 — 1.72%
  • August 2025 — 2.82%

The increase was 1.10%.

Overall Quarterly Results

The combination of optimized metadata, expanded set of locales, and updated visuals drove consistent, stable growth.

Growth in organic impressions and downloads over the promotion quarter:
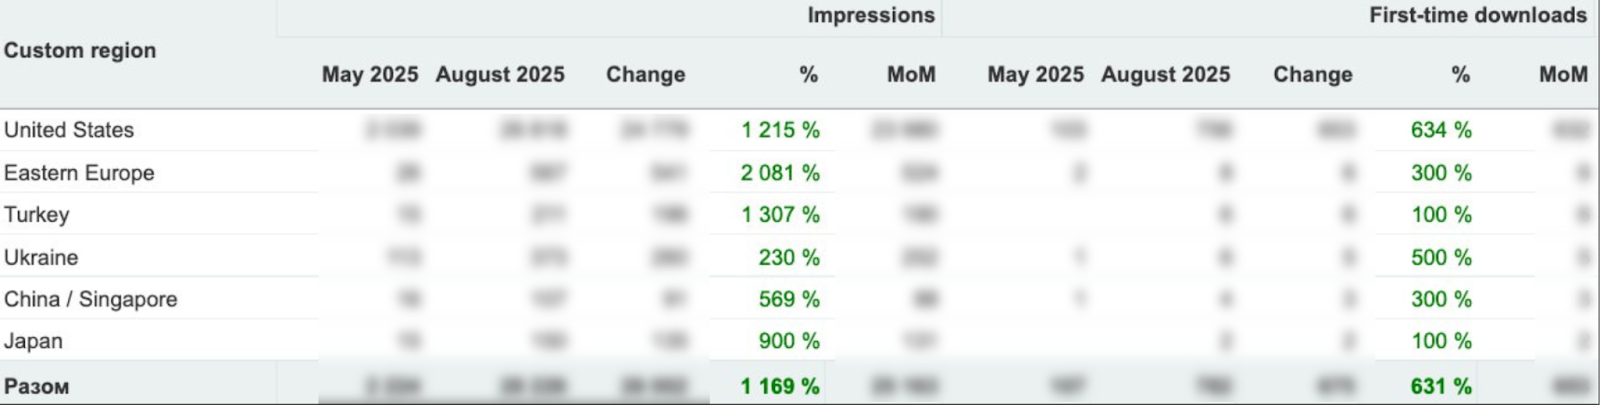
Region Impressions, % First-time Downloads, %
USA 1215 634
Eastern Europe 2081 300
Turkey 1307 100
Ukraine 230 500
China/Singapore 569 300
Japan 900 100
Total 1169 631

Campaign
Expenditure
Impressions
Taps
Installs
TTR
CR
Installs/Impr
Avg CPT
Avg CPA
Common term
-65.64%
-49.85%
-64.01%
-63.52%
-1.69%
0.81%
-0.98%
-5.13%
-6.06%
Data collection
-44.45%
-29.55%
-44.22%
-50.2%
-0.7%
-6.39%
-0.6%
0%
11.65%
Competitors brand
98.56%
80.41%
103.76%
92.01%
0.38%
-3.58%
0.12%
-2.38%
2.94%
Our brand
21.39%
23.01%
33.84%
32.65%
3.14%
-0.72%
2.27%
-8.33%
-6.82%
Discovery
-100%
-100%
-100%
-100%
-3.61%
-30.16%
-1.09%
-100%
-100%
Total
-0.6%
7.92%
11.72%
12.3%
0.2%
0.35%
0.16%
-11.36%
-12.31%
Group
Spend, $ %
Impressions %
Taps %
Installs %
Installs/Impr October, %
Installs/Impr November, %
Installs/Impr %
Avg CPT, $ %
Avg CPA, $ %
Competitor 1
42,98
83,11
63,3
50,48
3,74
3,08
-0,66
-12,2
-5,66
Common term
3,26
-3,73
3,92
26,67
0,57
0,75
0,18
0
-18,8
Competitors brand
120,26
59,82
47,02
0
0,49
0,31
-0,18
47,37
119,4
Data collection
15,12
-0,55
0,36
73,33
0,5
0,86
0,36
13,73
-33,51
Competitor 2
0,27
13,2
8,47
10,11
1,12
1,09
-0,03
-6,56
-9,02
Competitor 3
21,51
-2,06
-6,67
-8,33
0,43
0,4
-0,03
32
32,95
Our brand
3 575,62
3 646,79
3 544,9
3 553,66
37,61
36,68
-0,93
0
0
Competitor 4
-29,36
-35,77
-24,07
-33,7
0,61
0,63
0,02
-7,46
6,25
Relevant Competitors
69,42
26,03
51,35
48,95
6,3
7,45
1,15
12,2
14,29
Competitor 5
32,21
17,63
57,48
53,16
1,71
2,23
0,51
-15,71
-13,77
Competitor 6
-9,31
9,42
22,92
17,89
5,3
5,71
0,41
-27,08
-23,44
Total
33,96%
13,44%
87,29%
127,08%
1,36%
2,73%
1,37%
-29,09%
-40,74%
Custom region
Impressions
Units
1/7/2021 - 1/15/2021
1/16/2021 - 1/24/2021
Change
%
MoM
1/7/2021 - 1/15/2021
1/16/2021 - 1/24/2021
Change
%
MoM
United States
12 970
39 436
26 466
204 %
88 220
1 116
1 904
788
71 %
2 627
UK + Ireland
8 731
10 197
1 466
17 %
4 887
438
462
24
5 %
80
Germany + AT + CH + LU
1 974
6 235
4 261
216 %
14 203
203
291
88
43 %
293
France
1 500
4 390
2 890
193 %
9 633
182
237
55
30 %
183
Netherlands / Belgium
1 593
3 599
2 006
126 %
6 687
159
201
42
26 %
140
Ukraine
697
4 010
3 313
475 %
11 043
85
189
104
122 %
347
Canada
2 569
3 614
1 045
41 %
3 483
145
178
33
23 %
110
Northern Europe
1 273
2 024
751
59 %
2 503
117
175
58
50 %
193
Australia + NZ
1 754
3 324
1 570
90 %
5 233
137
160
23
17 %
77
Vietnam
352
2 712
2 360
670 %
7 867
32
144
112
350 %
373
Thailand
679
2 016
1 337
197 %
4 457
57
142
85
149 %
283
Arabic World
268
1 745
1 477
551 %
4 923
40
119
79
198 %
263
Spain
844
2 058
1 214
144 %
4 047
78
108
30
38 %
100
Eastern Europe
458
1 070
612
134 %
2 040
63
95
32
51 %
107
Italy
826
2 145
1 319
160 %
4 397
77
94
17
22 %
57
Turkey
338
2 309
1 971
583 %
6 570
34
87
53
156 %
177
Rest of World
426
1 457
1 031
242 %
3 437
48
81
33
69 %
110
Japan
553
5 113
4 560
825 %
15 200
18
80
62
344 %
207
India
234
1 169
935
400 %
3 117
15
75
60
400 %
200
Brazil
294
1 332
1 038
353 %
3 460
34
67
33
97 %
110
Hispanic America
318
784
466
147 %
1 553
42
51
9
21 %
30
Indonesia
206
525
319
155 %
1 063
20
41
21
105 %
70
Korea (South)
308
2 055
1 747
567 %
5 823
22
36
14
64 %
47
Malaysia
119
663
544
457 %
1 813
11
27
16
145 %
53
Taiwan + HK + Macau
145
532
387
267 %
1 290
9
24
15
167 %
50
Rest of Europe
82
287
205
250 %
683
12
22
10
83 %
33
Portugal
17
273
256
1 506 %
853
2
18
16
800 %
53
Israel
23
120
97
422 %
323
3
9
6
200 %
20
China / Singapore
78
134
56
72 %
187
6
7
1
17 %
3
Total
39 629
105 328
65 699
166 %
218 997
3 205
5 124
1 919
60 %
6 397

More Case Studies

Home
Up
Boost Your App
Please fill in the form below and we'll call you back in no time.