Scaling a Social App for Gamers on the App Store: +33% Impressions and +32% Installs

Service:
Sector:
Leisure
Author:
Published:
February 17, 2026
Team:
Romana Dutka
ASO Specialist
Olha Hrek
ASO Team Lead
Oleksii Volkov
Project Manager

Gaming apps operate in one of the most competitive environments on the App Store. Users make decisions quickly, and large platforms with strong brands and substantial budgets have long dominated search results and top rankings. For new or lesser-known products, this creates a constant battle for visibility and every single install.

This case study shows how we scaled a social app for gamers on the App Store, achieving +33% organic impressions and +32% installs in just three months.

Below, we outline the approach and solutions that made these results possible.

"

About Our partner

A social app for gamers that helps users find like-minded players and form teams based on shared interests and skill level.

Collaboration Goals

To improve App Store visibility and scale organic downloads.

Promotion Strategy

We developed a consistent action plan consisting of four key steps.

  1. Competitor analysis.
  2. Selection of markets and languages for scaling.
  3. Semantic core collection and metadata optimization.
  4. App page graphics update.

Step 1. Competitor Analysis

We collected and analyzed key competitors in the social gaming platform niche to identify priority markets with the highest potential for installs and revenue.

Geographic distribution of competitor downloads
Geographic distribution of competitor revenue streams

Step 2. Selecting Markets and Languages for Scaling

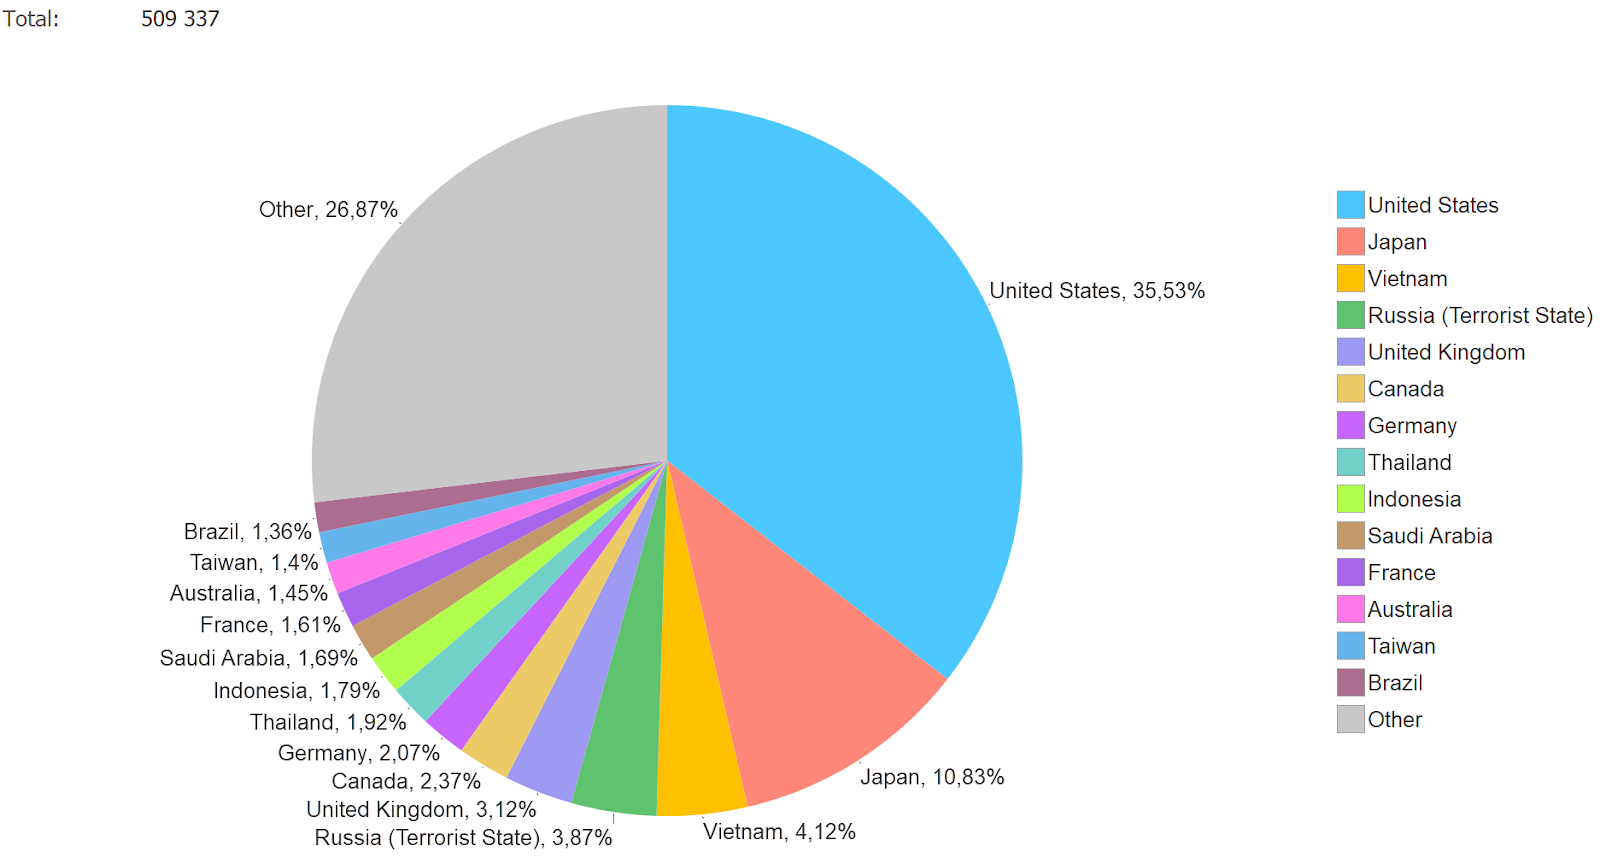
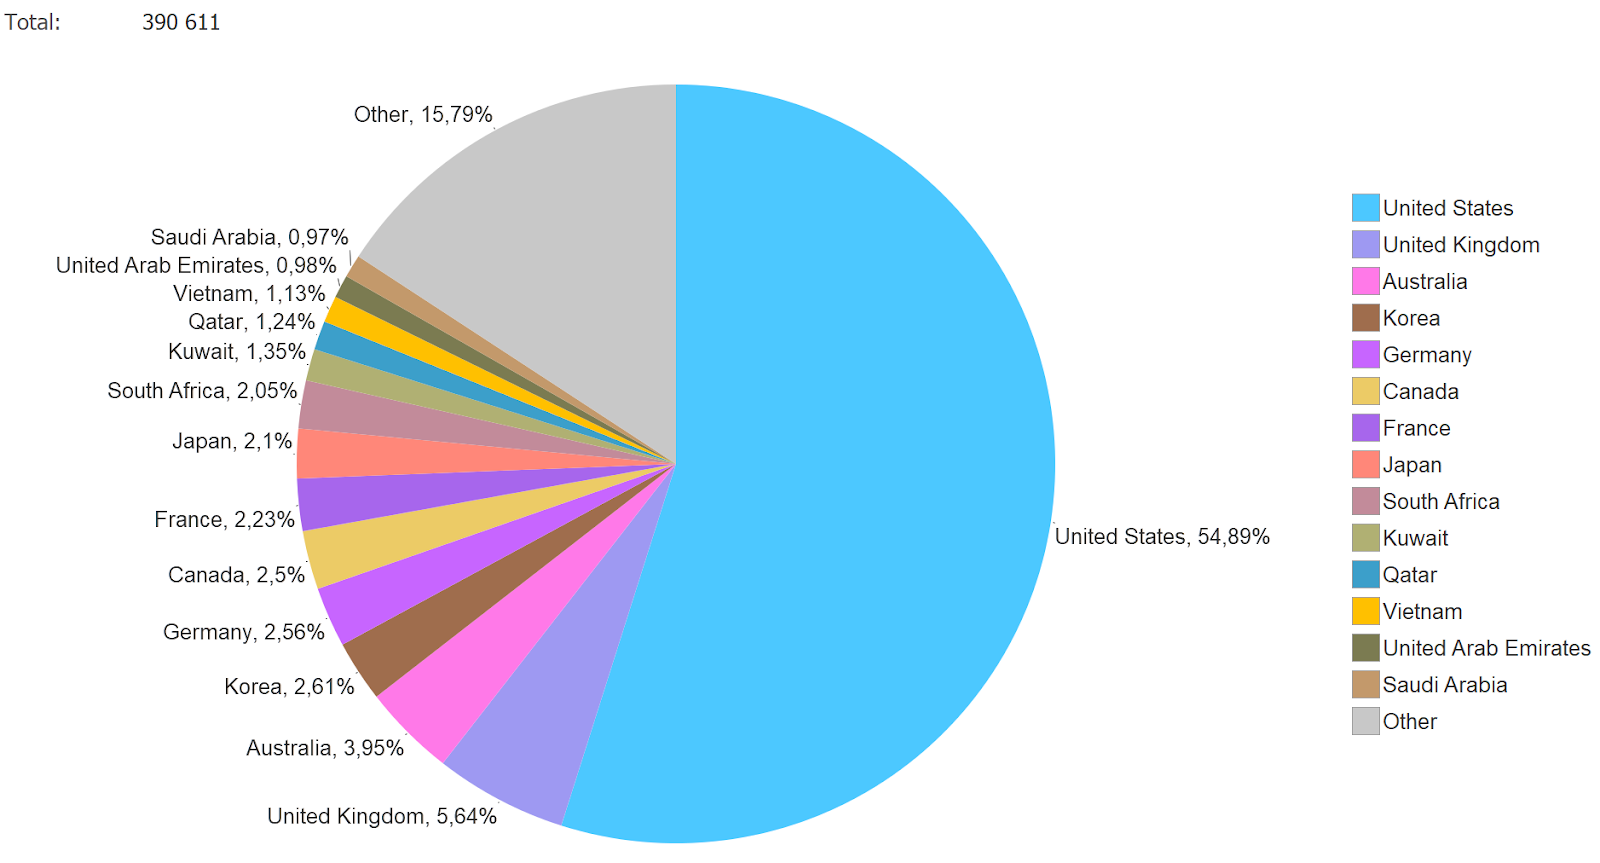
Based on the analysis results, we identified the priority locales for promoting the app: English (U.S.) and English (U.K.).

To scale coverage in the U.S. market, we added cross-localizations in Spanish (Mexico), Russian, Arabic, and Chinese (Simplified). This expanded our search presence without the need to launch additional regional app versions.

The RadASO team recommends using all available locales in each country to maximize the app's visibility in the App Store. For a detailed breakdown, see the RadASO table “Localizations and Country Coverage in the App Store.”

Step 3. Collecting the Semantic Core and Optimizing Metadata

Next, we formed a semantic core based on the most relevant search terms. To do this, we analyzed:

  • Keywords that users use to find competitors.
  • Search terms for which the app already appears in search results and its current positions.
  • Titles and subtitles of competitors using relevant keywords.
  • Search suggestions in the App Store.

Based on the analysis, we prepared metadata for the approved localizations. The strongest search terms in the category were used in the titles, while additional key phrases were distributed across other fields to expand coverage.

After publishing the updated metadata, we monitored initial results and implemented further updates, which helped secure the app’s top positions in search results.

Step 4. App Page Visual Optimization

In the next stage, the team focused on increasing the app's conversion rate using a CRO-driven approach to graphics.
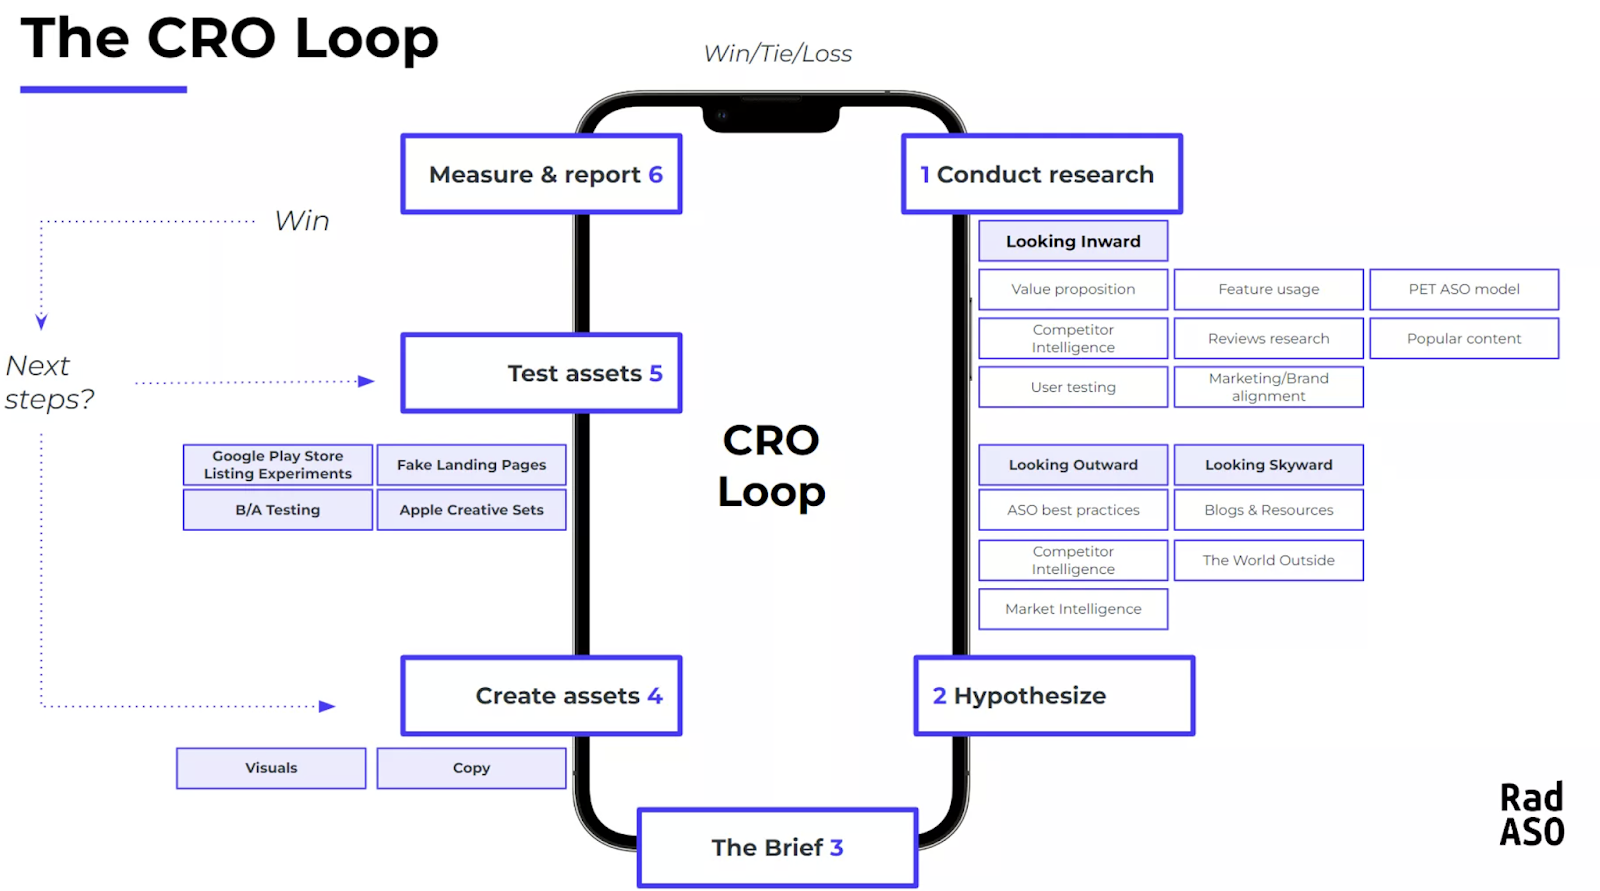
The CRO graphics workflow: from research and hypothesis formation to testing and iteration

In this step, we:

  • Conducted research on the partner’s product functionality and advantages, as well as competitors’ visual solutions
  • Formed hypotheses about how changes to specific elements could affect conversion
  • Created and tested updated graphics
  • Analyzed results and selected new hypotheses for further optimization

Our hypotheses for updating the screenshots:

  1. First Screenshot: Highlights active users alongside popular games and platforms to grab attention immediately and spark interest within the first seconds.
  2. Second Screenshot: Focuses on popular games to clearly communicate the app’s context and value to the target audience.
  3. Third Screenshot: Depicts a live interaction scenario—a chat between players coordinating gameplay—to make the user experience clear and relatable.
  4. Fourth Screenshot: Showcases profile settings, testing whether personalization enhances the perception of the app’s functionality.
  5. Fifth Screenshot: Highlights player search and communication tools, examining how demonstrating additional features influences the install decision.

We also developed hypotheses regarding the app’s color scheme, screenshot text, mockups, and supporting graphic elements.

Learn how to properly localize a page and scale it across dozens of countries in our Case Study on a casual game.

Promotion Results

Text ASO

1. After updating the metadata, the app reached the TOP 10 for highly popular keywords in priority regions—the U.S. and the U.K.

Dynamics of the App’s Search Rankings for Keywords in the U.S. App Store
Dynamics of the App’s Search Rankings for Keywords in the U.K. App Store

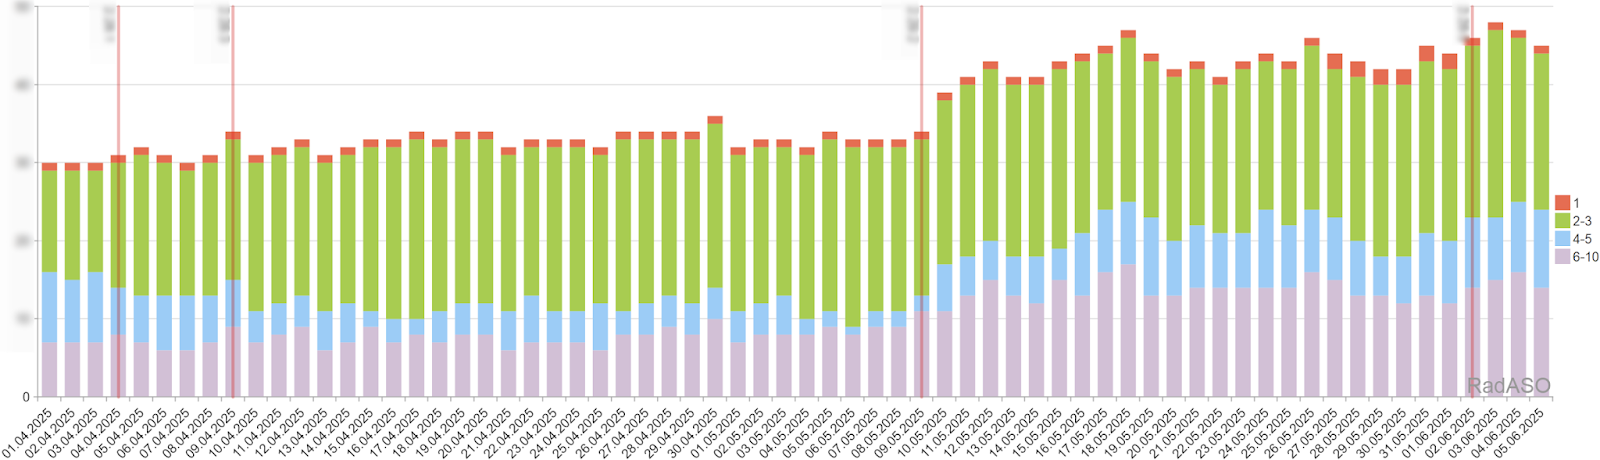
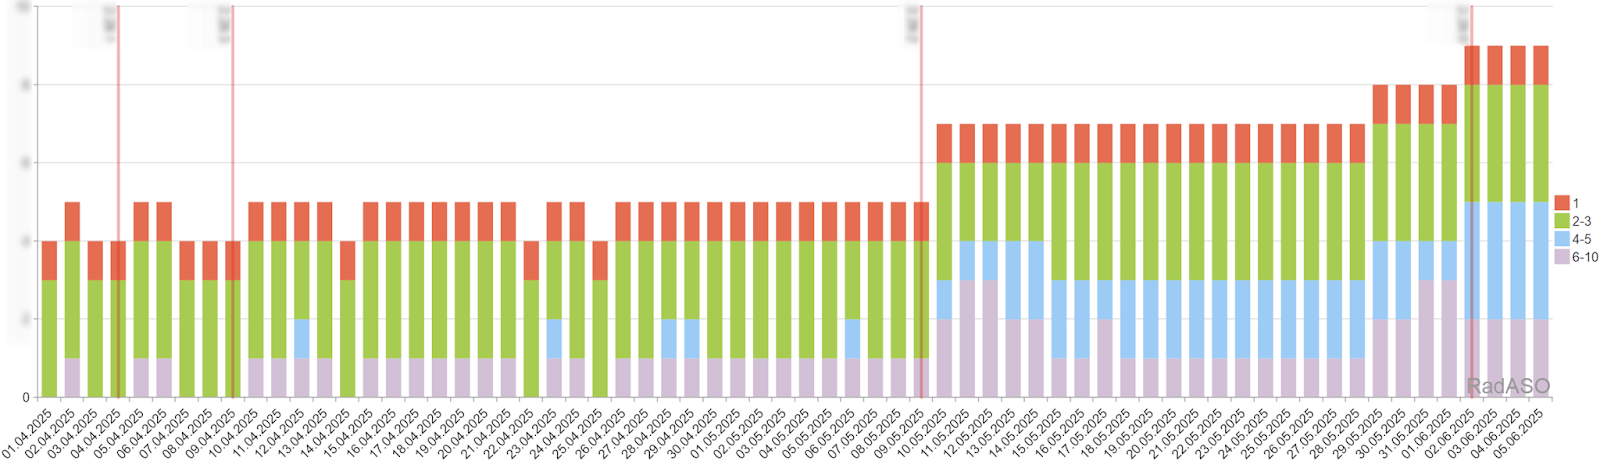
Thanks to the updated localizations for the U.S. and U.K., the positive ranking dynamics extended to other countries where these language versions influence App Store search results.

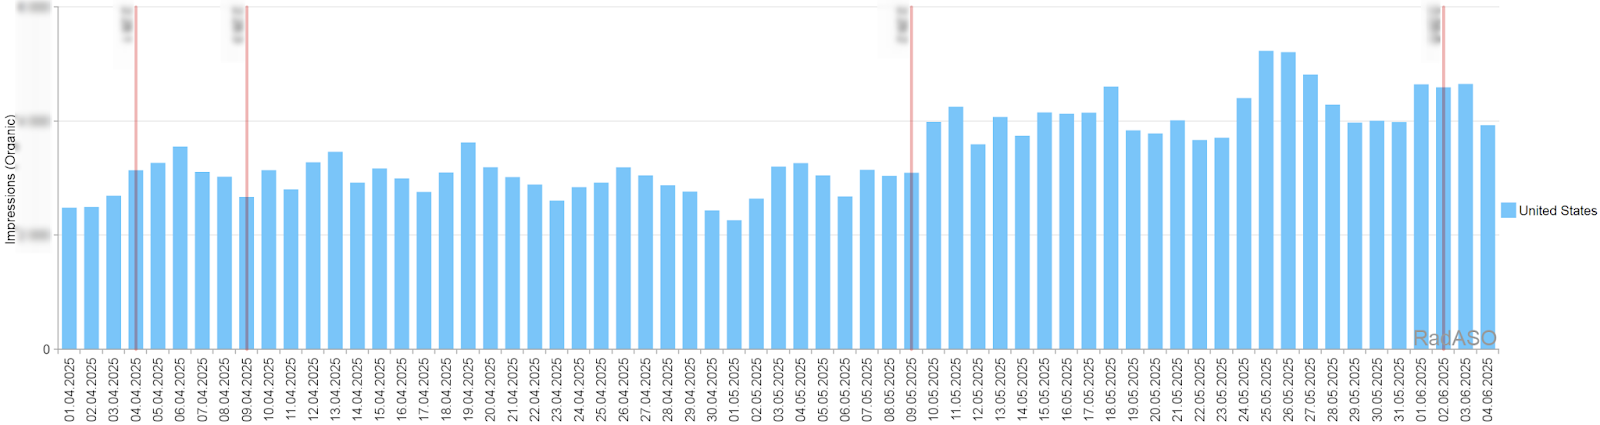
2. In the target regions, impressions grew by 33%, providing a foundation for further growth in installations (+6%).

Graph showing the growth of organic impressions for the app in the U.S.

Graphic ASO

As part of the graphics optimization process, the team tested an updated set of screenshots with different visual accents. A/B testing results showed the new images increased App Store page conversion by 12.28%.

After implementing the updated graphics, conversion rates improved as follows:

  • in the US;
  • in the UK;
  • … and across all countries overall.

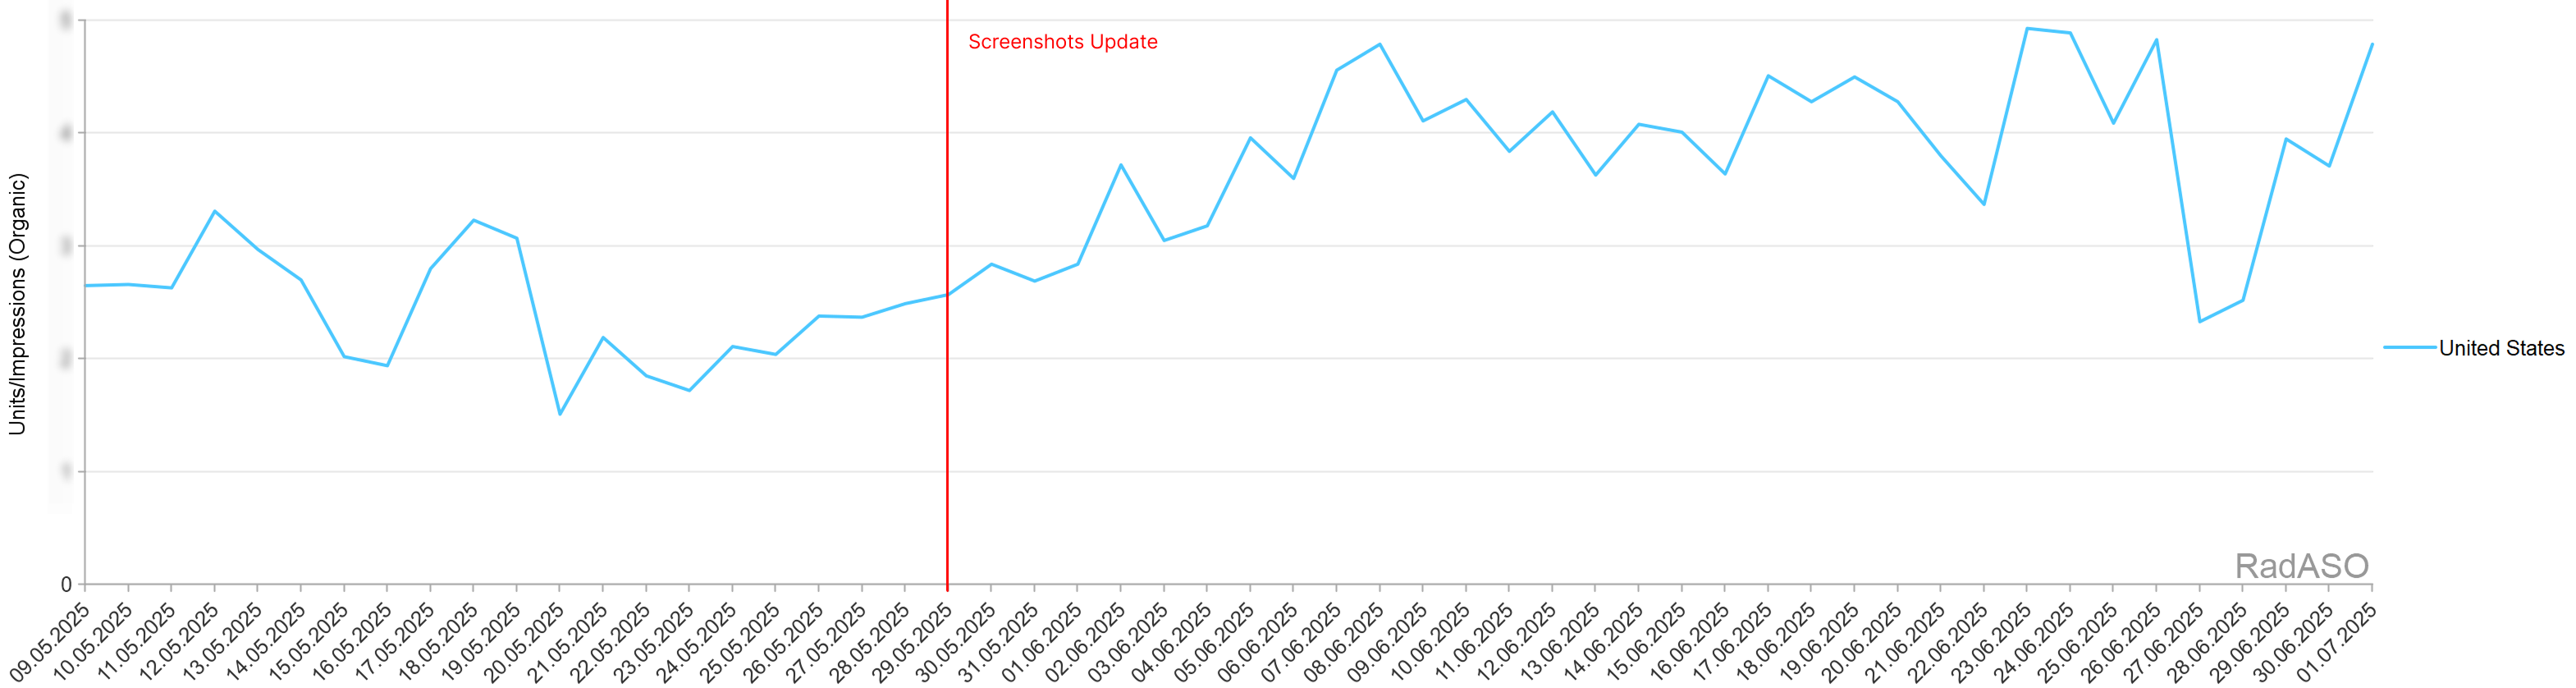
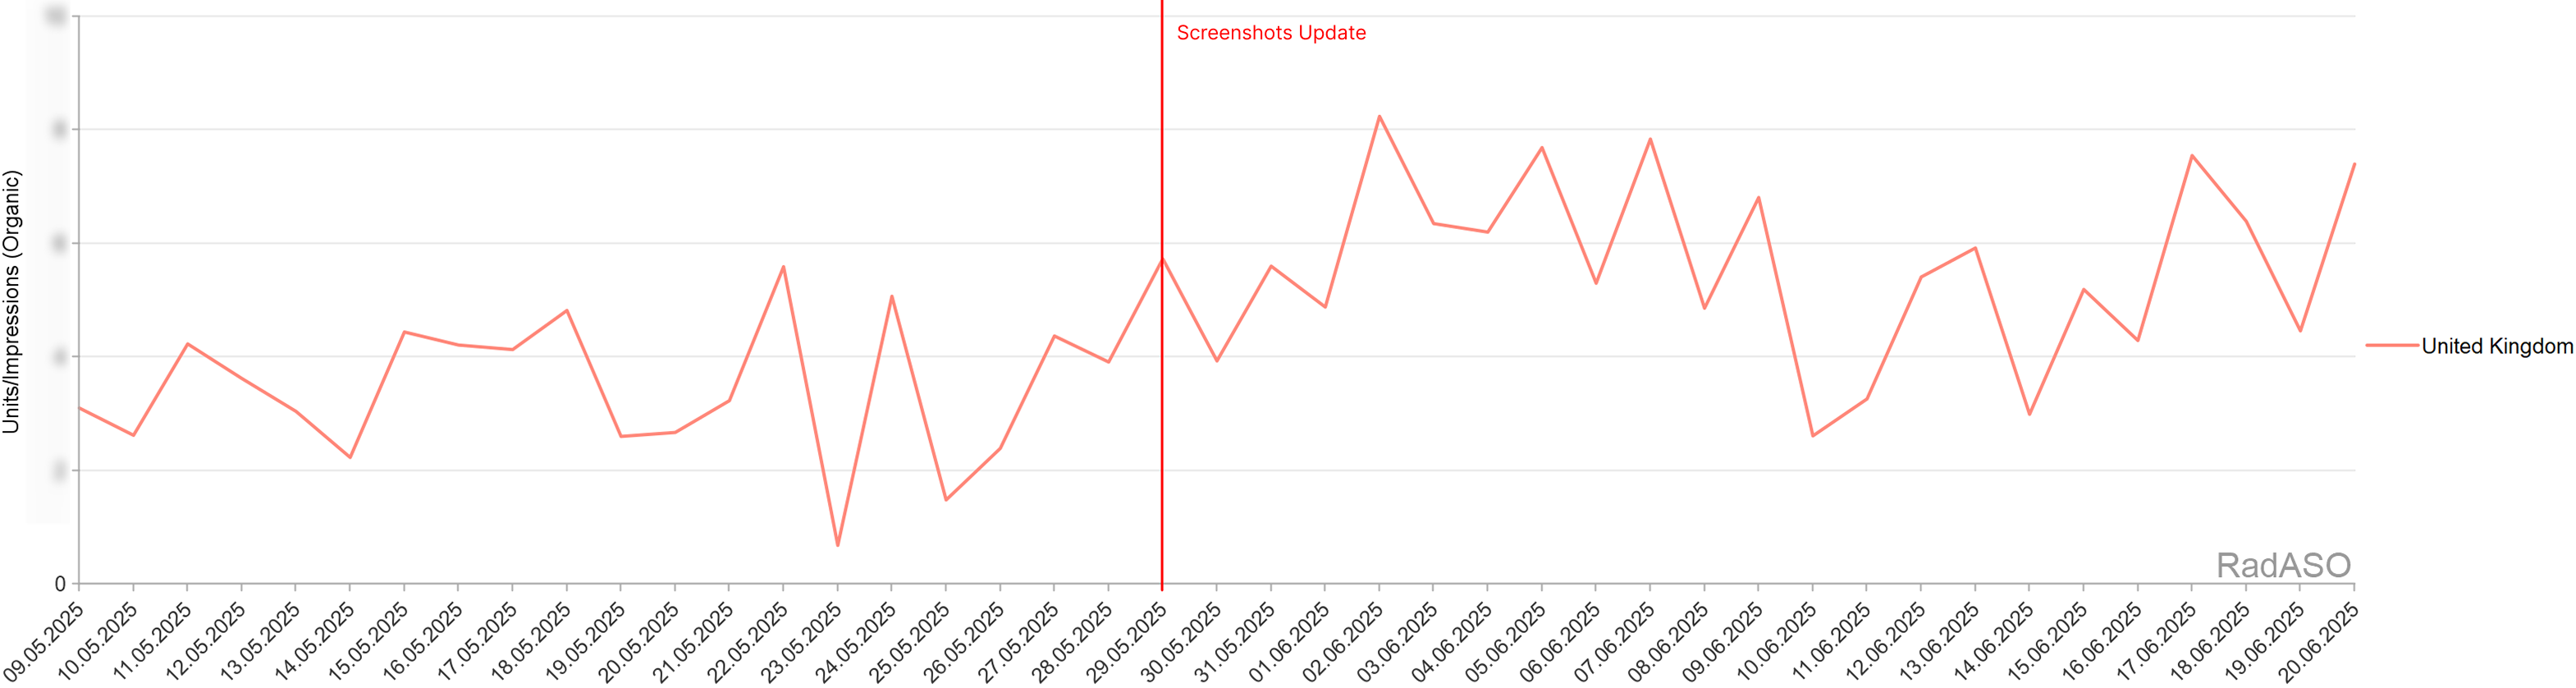
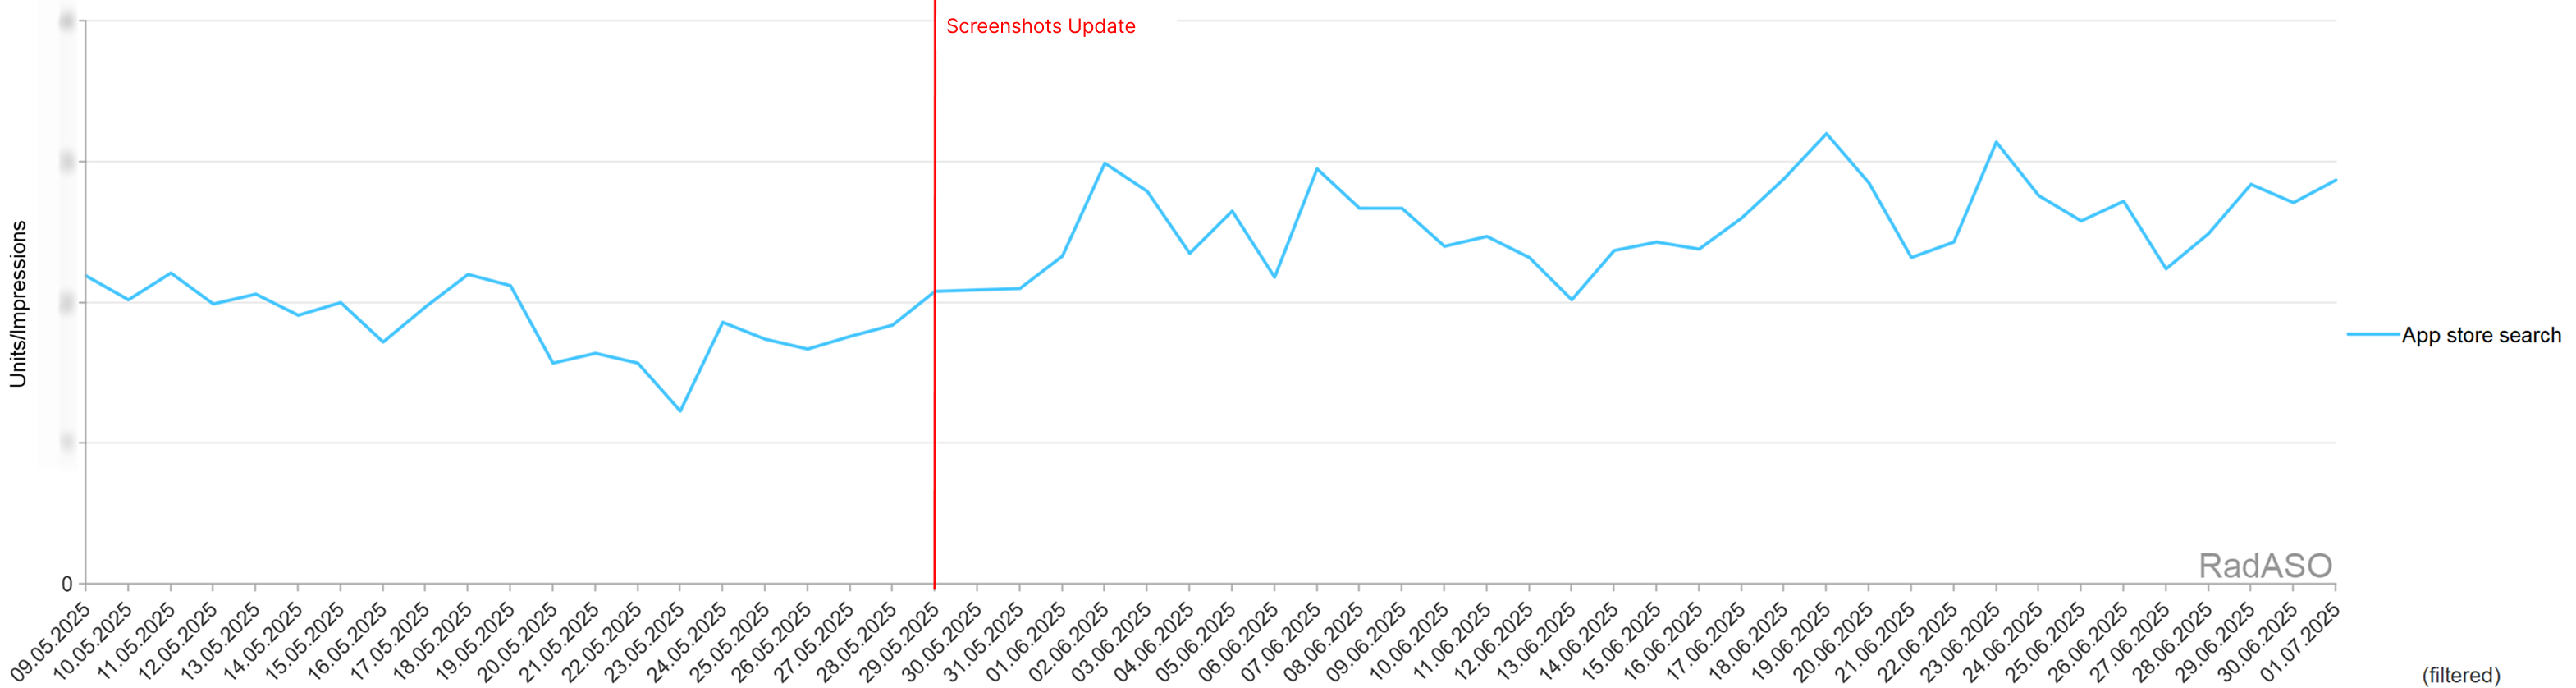
As a result of testing and updating the screenshots, total app downloads increased by 32%.

Campaign
Expenditure
Impressions
Taps
Installs
TTR
CR
Installs/Impr
Avg CPT
Avg CPA
Common term
-65.64%
-49.85%
-64.01%
-63.52%
-1.69%
0.81%
-0.98%
-5.13%
-6.06%
Data collection
-44.45%
-29.55%
-44.22%
-50.2%
-0.7%
-6.39%
-0.6%
0%
11.65%
Competitors brand
98.56%
80.41%
103.76%
92.01%
0.38%
-3.58%
0.12%
-2.38%
2.94%
Our brand
21.39%
23.01%
33.84%
32.65%
3.14%
-0.72%
2.27%
-8.33%
-6.82%
Discovery
-100%
-100%
-100%
-100%
-3.61%
-30.16%
-1.09%
-100%
-100%
Total
-0.6%
7.92%
11.72%
12.3%
0.2%
0.35%
0.16%
-11.36%
-12.31%
Group
Spend, $ %
Impressions %
Taps %
Installs %
Installs/Impr October, %
Installs/Impr November, %
Installs/Impr %
Avg CPT, $ %
Avg CPA, $ %
Competitor 1
42,98
83,11
63,3
50,48
3,74
3,08
-0,66
-12,2
-5,66
Common term
3,26
-3,73
3,92
26,67
0,57
0,75
0,18
0
-18,8
Competitors brand
120,26
59,82
47,02
0
0,49
0,31
-0,18
47,37
119,4
Data collection
15,12
-0,55
0,36
73,33
0,5
0,86
0,36
13,73
-33,51
Competitor 2
0,27
13,2
8,47
10,11
1,12
1,09
-0,03
-6,56
-9,02
Competitor 3
21,51
-2,06
-6,67
-8,33
0,43
0,4
-0,03
32
32,95
Our brand
3 575,62
3 646,79
3 544,9
3 553,66
37,61
36,68
-0,93
0
0
Competitor 4
-29,36
-35,77
-24,07
-33,7
0,61
0,63
0,02
-7,46
6,25
Relevant Competitors
69,42
26,03
51,35
48,95
6,3
7,45
1,15
12,2
14,29
Competitor 5
32,21
17,63
57,48
53,16
1,71
2,23
0,51
-15,71
-13,77
Competitor 6
-9,31
9,42
22,92
17,89
5,3
5,71
0,41
-27,08
-23,44
Total
33,96%
13,44%
87,29%
127,08%
1,36%
2,73%
1,37%
-29,09%
-40,74%
Custom region
Impressions
Units
1/7/2021 - 1/15/2021
1/16/2021 - 1/24/2021
Change
%
MoM
1/7/2021 - 1/15/2021
1/16/2021 - 1/24/2021
Change
%
MoM
United States
12 970
39 436
26 466
204 %
88 220
1 116
1 904
788
71 %
2 627
UK + Ireland
8 731
10 197
1 466
17 %
4 887
438
462
24
5 %
80
Germany + AT + CH + LU
1 974
6 235
4 261
216 %
14 203
203
291
88
43 %
293
France
1 500
4 390
2 890
193 %
9 633
182
237
55
30 %
183
Netherlands / Belgium
1 593
3 599
2 006
126 %
6 687
159
201
42
26 %
140
Ukraine
697
4 010
3 313
475 %
11 043
85
189
104
122 %
347
Canada
2 569
3 614
1 045
41 %
3 483
145
178
33
23 %
110
Northern Europe
1 273
2 024
751
59 %
2 503
117
175
58
50 %
193
Australia + NZ
1 754
3 324
1 570
90 %
5 233
137
160
23
17 %
77
Vietnam
352
2 712
2 360
670 %
7 867
32
144
112
350 %
373
Thailand
679
2 016
1 337
197 %
4 457
57
142
85
149 %
283
Arabic World
268
1 745
1 477
551 %
4 923
40
119
79
198 %
263
Spain
844
2 058
1 214
144 %
4 047
78
108
30
38 %
100
Eastern Europe
458
1 070
612
134 %
2 040
63
95
32
51 %
107
Italy
826
2 145
1 319
160 %
4 397
77
94
17
22 %
57
Turkey
338
2 309
1 971
583 %
6 570
34
87
53
156 %
177
Rest of World
426
1 457
1 031
242 %
3 437
48
81
33
69 %
110
Japan
553
5 113
4 560
825 %
15 200
18
80
62
344 %
207
India
234
1 169
935
400 %
3 117
15
75
60
400 %
200
Brazil
294
1 332
1 038
353 %
3 460
34
67
33
97 %
110
Hispanic America
318
784
466
147 %
1 553
42
51
9
21 %
30
Indonesia
206
525
319
155 %
1 063
20
41
21
105 %
70
Korea (South)
308
2 055
1 747
567 %
5 823
22
36
14
64 %
47
Malaysia
119
663
544
457 %
1 813
11
27
16
145 %
53
Taiwan + HK + Macau
145
532
387
267 %
1 290
9
24
15
167 %
50
Rest of Europe
82
287
205
250 %
683
12
22
10
83 %
33
Portugal
17
273
256
1 506 %
853
2
18
16
800 %
53
Israel
23
120
97
422 %
323
3
9
6
200 %
20
China / Singapore
78
134
56
72 %
187
6
7
1
17 %
3
Total
39 629
105 328
65 699
166 %
218 997
3 205
5 124
1 919
60 %
6 397

More Case Studies

Home
Up
Boost Your App
Please fill in the form below and we'll call you back in no time.